
Risk Off Deteriorates, More Work Must Be Done In Equities
The State of Affairs in Financial Markets
Tentative signs of a crack in this year’s ‘risk on’ conditions appear to have returned, even if it’s still quite premature to place too high one’s bets on follow through tendencies off the bat. Even if the flows have clearly reverted into a short-term ‘risk off’ mode, one should exercise caution as all we’ve seen is a break below the 5-DMAs in most risk measures.
There is still more work to be done to orchestrate a true turn in the constructive market rhythm present in 2019 by a fracture in the short-term bullish cycle in US equities, combined with a downward slope in the 5-DMA. This pattern should then morph into US fixed income, vol, US credit (junk bonds) to strengthen the ‘risk off’ notion.
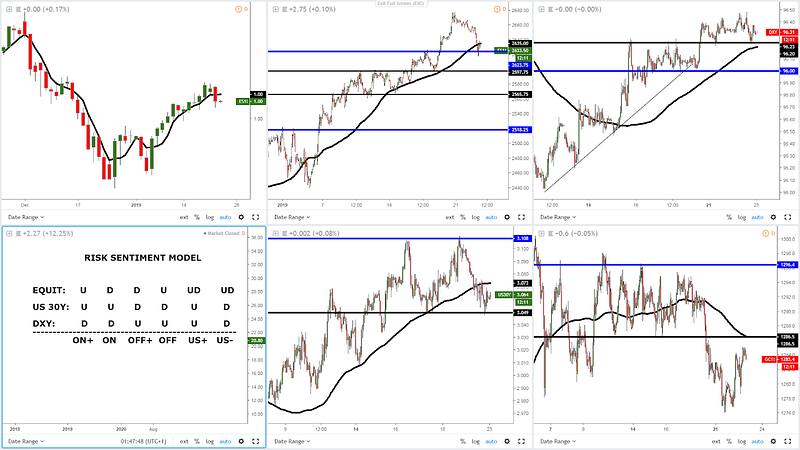
Nonetheless, there are some reasons to be concerned about Tuesday’s price action as the S&P 500 suffered its worst losing day this year, down by more than 2.5%, as investors flock back to the safety of US bonds, bid up volatility and dump credit (junk-type). The spike back above the 20% mark in the VIX won’t be a welcoming event to appease the growing signs of unrest in the market place either.
The outperformance of the Japanese Yen, leaving aside a strong Pound as a worst case ‘hard Brexit’ scenario is rapidly being removed from the equation, is also a reflection that the market is worried where the Sino-US trade talks stand. Flows suggest the negotiations have reached an impasse.
I’ve argued that a deal may eventually come to fruition as it’s in both countries’ interest to create economic stimulus, which is precisely what the market has been discounting judging by the rapid recovery see in the risk profile this year. However, negotiations in contentious issues at the core of China’s strategic vision (telecommunications, technology) were always going to create more friction. The two countries are walking through a tight rope trying to project messages of calculated optimism even if the levels of trust between the two countries is at all-time low levels.
We all know the story driving markets in January orbits around a prolonged resolution in the US-China trade stand-off, so it is no surprise that the pendulum has swung back into the risk-off side in the last 24h after a flurry of negative headlines. It all started to turn ugly when in the Asian session we learned that the contentious issue with Huawei’s CFO Wanzhou Meng is not getting any better after the Canadian press revealed that the US will proceed with a formal request to extradite the executive and daughter of Huawei’s Founder, China’s largest technology company. Ever since the case came to the public spotlight, the market has been quite sensitive, treating Ms. Meng’s related headlines as a proxy to gauge the possible evolution in the US-China relationships, hence a satisfactory deal in trade.
One could also blame an unexpectedly gloomy outlook by Chinese President Xi at an unusual meeting with business leaders as a reason to dent the risk profile. In his speech, Xi implied that the country is in shaky grounds and that even if this week’s data dump out of China saved the day by coming in line with expectations, the country may be decelerating at a faster rate than what the numbers are telling us. The comments contributed to the reinvigoration of risk-off flows, as did yet another sanctimonious-toned tweet via US President Trump. You could also throw into the mix the IMF downgrading the global growth outlook, even if that’s yesterday’s news today.
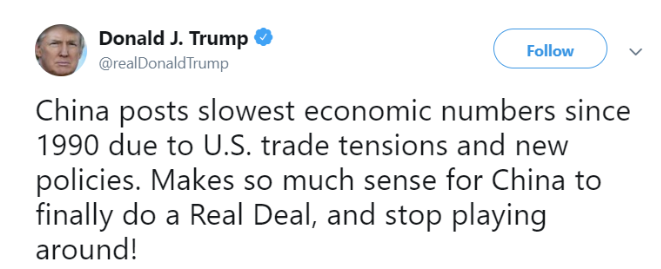
Source: @realdonaldtrump
Still on the Sino-US front, it only got worse as the days progressed, as a reputable source as the Financial Times is, reported that the Trump administration had turned down an offer by two Chinese vice ministers to attend upcoming trade talk meetings due to the lack of progress on force technology transfers and potentially far-reaching structural reforms to China’s economy. Director of the National Economic Council Mr. Kudlow tried to calm the waters by noting that the there is no cancellation of the preparatory meetings with China. At this stage, considering the dual weakening trends in economic data from both the US and China, I can’t envision an outright stall in trade talks. Kudlow reminded us of the significance in the upcoming trade talks with China as ‘big meeting’.
Turning our attention to the US, the debilitating economic growth pattern was further manifested on Tuesday after an undershoot in the US existing home sales, coming at -6.4% vs -1.5% exp. The falls in existing house sales is alarming as the index reaches its lowest levels since 2015. Even if I hate to be the bearer of bad news, the data runs the risk of only getting worse before it gets better as the US government shutdown extends into its 32nd day. Coming from the horse’s mouth, even if it’s not rocket science to come to such conclusion, Mr. Kudlow logically acknowledged that the US is set to lose growth even if he is confident of a snapback after the shutdown is over. By connecting the dots, weaker US growth is a precursor for a prolonged pause by the Fed in its tightening mode. I am personally not shying away from stating that we’ve probably seen the peak in US rates. For now, the general perception, attested by the USD performance, is that it won’t affect the outlook for the domestic currency but we are getting into muddy terrain here, so don’t be complacent.
A currency that deserves its own mention is the Sterling, ending as the top performer alongside the Japanese Yen, even if the risk conditions saw a marked deterioration. The Sterling was not only propelled by the ongoing discounting of a no ‘hard Brexit’ while the option of a 2nd referendum is considered but also via improved UK nov average weekly earnings coming at 3.4% vs 3.3% on 3m/y. The figures were the highest since July 2008, with the rest of indicators also showing clear signs that the UK labor is at the healthiest levels in years. It should be no wonder that the UK yield curve is shaping up a bear steepener formation, which communicates bond traders are discounting heightened chances of stronger economic growth and higher rates.
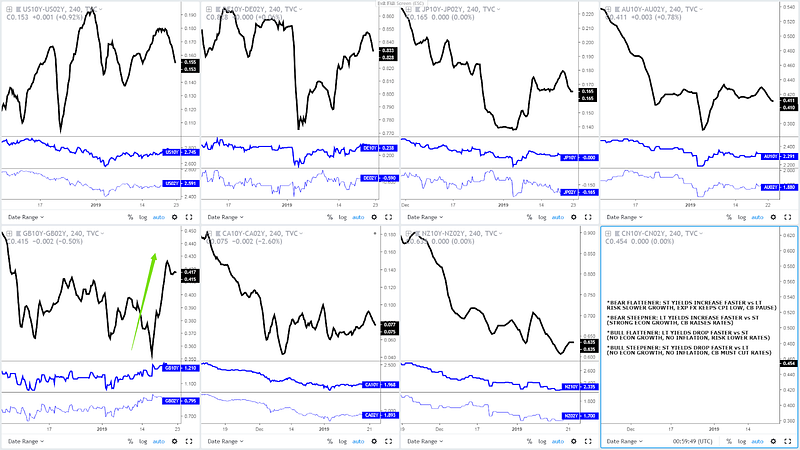
Source: Global Prime Trading View
Viraj Patel, FX & Global Macro Strategist at Arkera, sums it up for us:
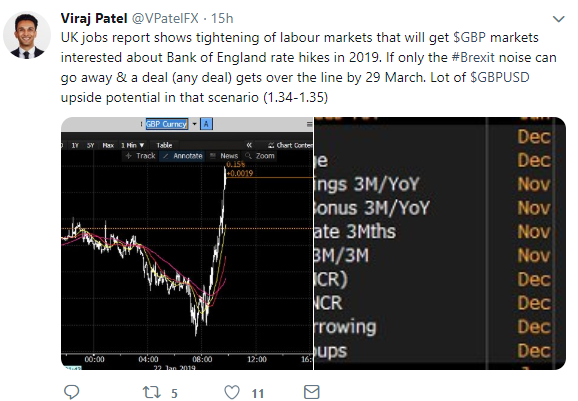
Source: @vpatelfx
When it comes to the Eurozone, the augurs for a pick up in economic activity are simply not there. If anything, Tuesday’s economic data out of Germany should reaffirm the calls for the ECB to lower its overly inflated economic growth outlook when they meet on Thursday. The proof is in the pudding, in this case, in the German Jan ZEW survey, exhibiting a further collapse in the current economic situation and sentiment, which adds to the mountain of negative indicators from H2 2018.
Risk Events In The Economic Calendar
Looking ahead, today’s key events include the BoJ monetary policy statement and the Canadian retail sales. The former is expected to have a muted effect in the JPY, which will remain subject to risk-on/risk-off flows, while the CAD is set to wobble on the release of the retail sales data, with a fairly poor outlook heading into Wednesday amid the sharp fall in Oil prices.
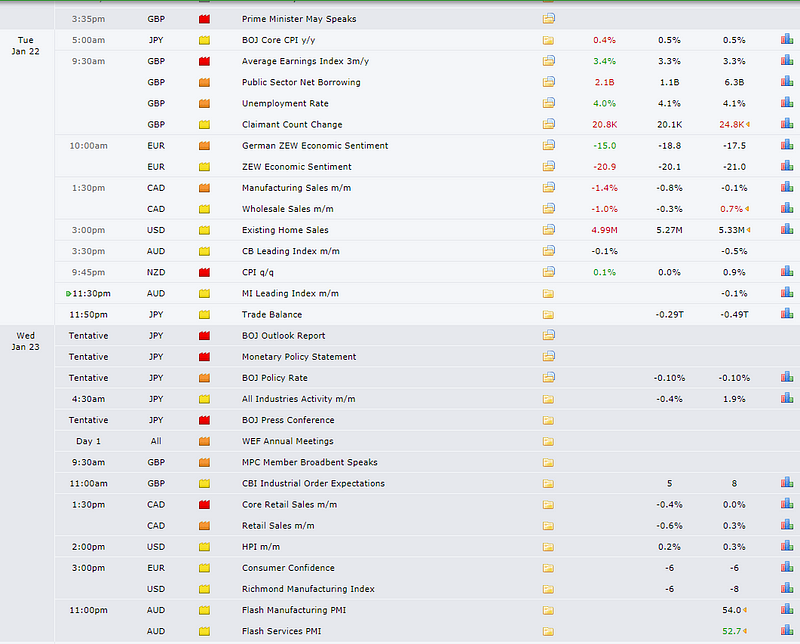
Source: forexfactory
Besides, pay attention to the line up of companies that will be reporting earnings in coming days to set the tone in stocks.
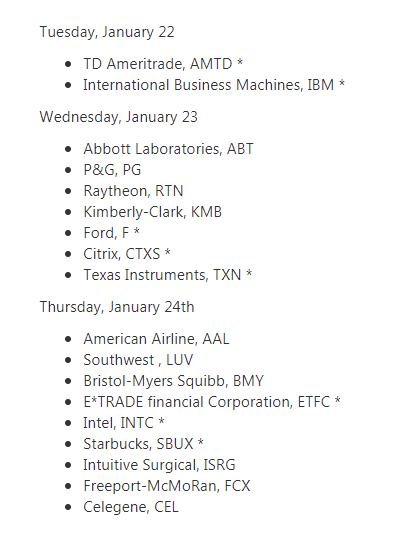
Source: Forexlive
Daily Chart Insights — Trading Opportunities
AUD/USD — Vulnerable To Further Downside
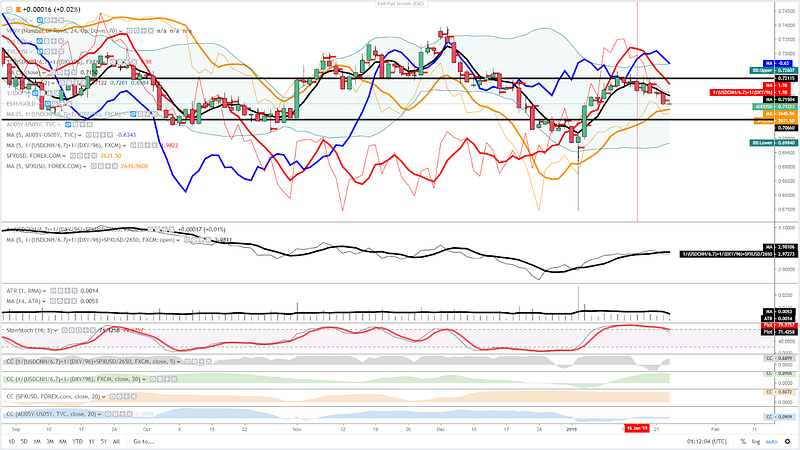
The bearish dynamics in the Aussie are at risk of extending further to the downside. This outlook is predicated on an array of convergences when analyzing the pressures emanating from correlated instruments. The roll-over in global equities, with the S&P 500 acting as a bellwether (in orange) is a red flag, which adds to the ongoing upward momentum in the USD index/weaker CNH (in red). Ideally, we should see the 5DMA off the orange line sloping down in the next 24h. The carving out of a top in the Aus vs US 5-year bond yield spread adds evidence that capital flows should not act as a catalyst to strengthen the AUD either. The slow stochastic is also coming out of overbought territory, which essentially suggests that the downward moving motion is the prevalent rhythm in the market at this stage. It’s also interesting to spot how the Point of Control in the last 24h was left out above the closing of the price at NY. Talking about closes, the fact that the bar ended NY trading at the very lows of the day should be another worry for bulls.
USD/CAD — Bullish Momentum Regained
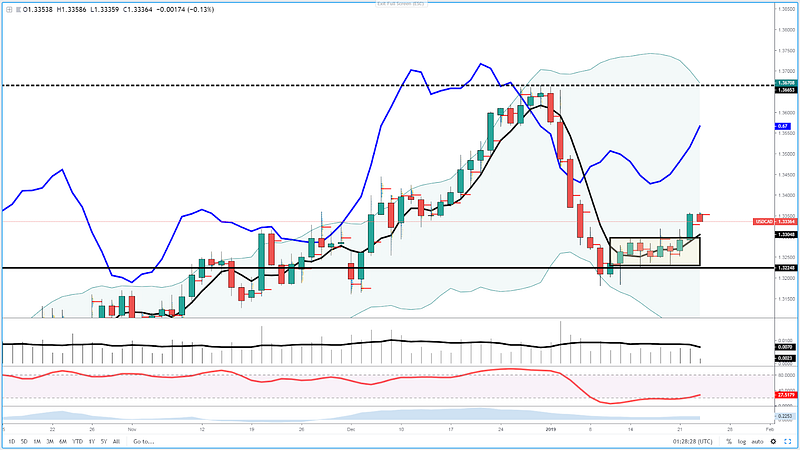
The US Dollar looks set to make further gains against its neighboring country’s currency, the Loonie. In the last 2 weeks, the market has come out of its 2-week range by breaking to the upside, achieving a successful auction which found broad-based acceptance by the end of business in NY. The resolution of the range comes packed with a plethora of positives. The slow stochastic is coming out of oversold territory, the most heavily traded level was trapped behind the price close, the shape of the 5DMA is telling us the momentum is unambiguously bullish, the 5-DMA of the US vs CA 5-year bond yield spread is gathering steam (see blue line), while Oil prices are on a slant again. Buy on dip campaigns should be very active in this market. Watch today’s vol emerging off CA retail sales.
GBP/JPY — Evidence Mounts Over Upside Risks
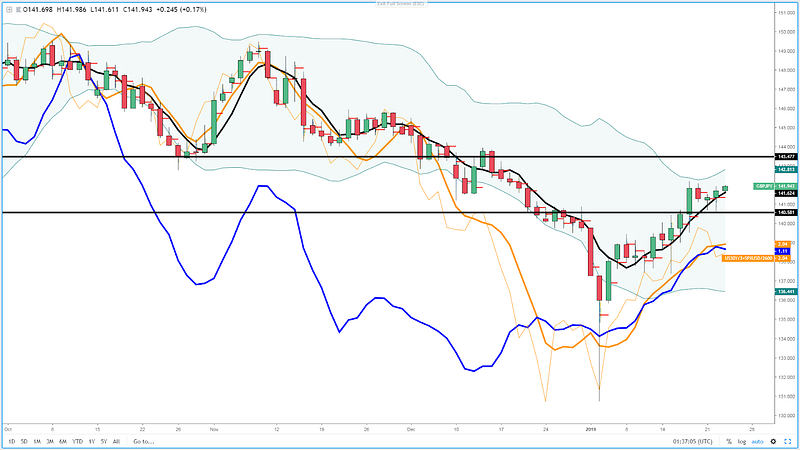
One market that I find particularly interesting to trade long is the Sterling against the Japanese Yen. After breaking through resistance at 140.50/60, bulls have exerted unambiguous control of the price action in the last 48h by printing back-to-back bullish rejection bars (also known as pin bars). The continuation of the bullish momentum, therefore, appears to be the path of least resistance, judging by the alignment of price action with the steep angle of the bullish 5-DMA or the fact that even if equities are starting to roll over, the 5-DMA on the S&P 500 still points upwards. There is, therefore, a case to be made for the Sterling to test the next key area of resistance at 143.40/50.
Important Footnotes
- Risk model: The fact that financial markets have become so intertwined and dynamic makes it essential to stay constantly in tune with market conditions and adapt to new environments. This prop model will assist you to gauge the context that you are trading so that you can significantly reduce the downside risks. To understand the principles applied in the assessment of this model, refer to the tutorial How to Unpack Risk Sentiment Profiles
- Cycles: Markets evolve in cycles followed by a period of distribution and/or accumulation. The weekly cycles are highlighted in red, blue refers to the daily, while the black lines represent the hourly cycles. To understand the principles applied in the assessment of cycles, refer to the tutorial How To Read Market Structures In Forex
- POC: It refers to the point of control. It represents the areas of most interest by trading volume and should act as walls of bids/offers that may result in price reversals. The volume profile analysis tracks trading activity over a specified time period at specified price levels. The study reveals the constant evolution of the market auction process. If you wish to find out more about the importance of the POC, refer to the tutorial How to Read Volume Profile Structures
- Tick Volume: Price updates activity provides great insights into the actual buy or sell-side commitment to be engaged into a specific directional movement. Studies validate that price updates (tick volume) are highly correlated to actual traded volume, with the correlation being very high, when looking at hourly data. If you wish to find out more about the importance tick volume, refer to the tutorial on Why Is Tick Volume Important To Monitor?
- Horizontal Support/Resistance: Unlike levels of dynamic support or resistance or more subjective measurements such as fibonacci retracements, pivot points, trendlines, or other forms of reactive areas, the horizontal lines of support and resistance are universal concepts used by the majority of market participants. It, therefore, makes the areas the most widely followed and relevant to monitor. The Ultimate Guide To Identify Areas Of High Interest In Any Market
- Trendlines: Besides the horizontal lines, trendlines are helpful as a visual representation of the trend. The trendlines are drawn respecting a series of rules that determine the validation of a new cycle being created. Therefore, these trendline drawn in the chart hinge to a certain interpretation of market structures.
- Correlations: Each forex pair has a series of highly correlated assets to assess valuations. This type of study is called inter-market analysis and it involves scoping out anomalies in the ever-evolving global interconnectivity between equities, bonds, currencies, and commodities. If you would like to understand more about this concept, refer to the tutorial How Divergence In Correlated Assets Can Help You Add An Edge.
- Fundamentals: It’s important to highlight that the daily market outlook provided in this report is subject to the impact of the fundamental news. Any unexpected news may cause the price to behave erratically in the short term.
- Projection Targets: The usefulness of the 100% projection resides in the symmetry and harmonic relationships of market cycles. By drawing a 100% projection, you can anticipate the area in the chart where some type of pause and potential reversals in price is likely to occur, due to 1. The side in control of the cycle takes profits 2. Counter-trend positions are added by contrarian players 3. These are price points where limit orders are set by market-makers. You can find out more by reading the tutorial on The Magical 100% Fibonacci Projection
The Daily Edge is authored by Ivan Delgado, Head of Market Research at Global Prime. The purpose of this content is to provide an assessment of the market conditions. The report takes an in-depth ...
more

