
Rising Trend Of U.S. New Home Sale Prices Breaking Down
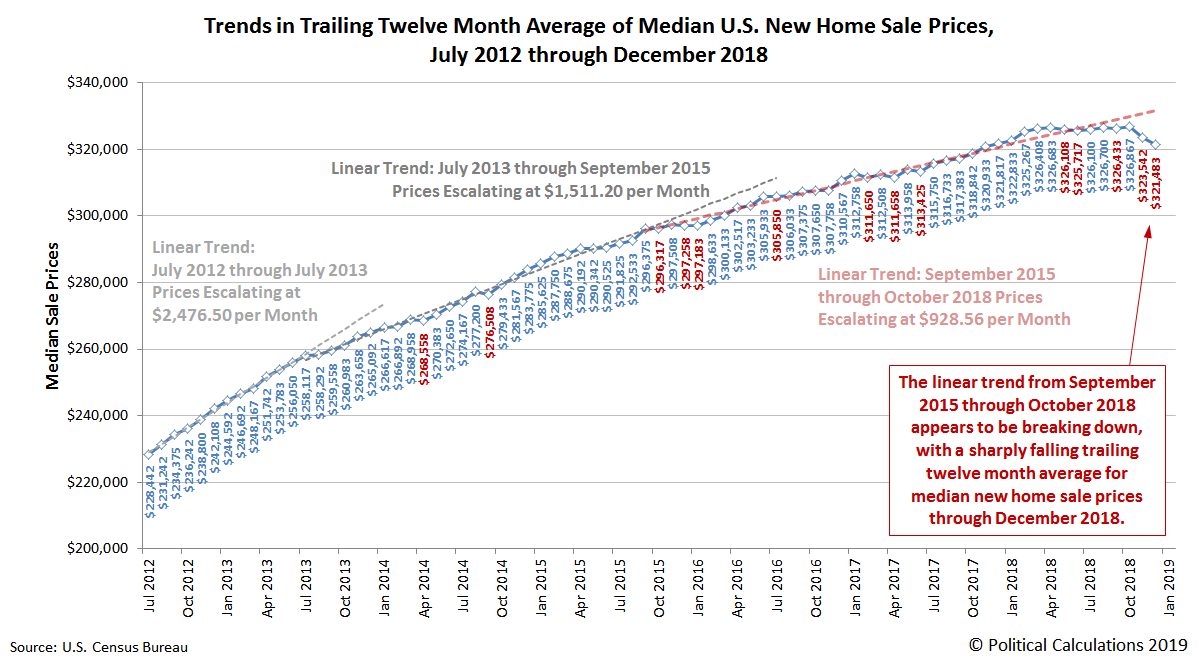
What had been a well-established, rising trend for median U.S. new home sale prices appears to have begun breaking in the fourth quarter of 2018.
As measured by the trailing twelve month average of median new home sale prices in the United States, the most recent trend that had begun in September 2015 looks to have lasted into October 2018, after which, the trailing year average of these median prices has dropped significantly. The following chart shows the three most recent linear trends for the trajectory of new home sale prices in the United States, covering the period from July 2012 through December 2018.
We calculate the trailing twelve month average of median new home sale prices for two reasons. First, it helps take annual seasonality in the data into account, and second, it smooths out the noise in fairly volatile monthly data to help make trends in the data more visible. The next chart shows the raw monthly data for median and average new home sale prices in the U.S. from January 2000 through December 2018, where we find that one reason for the sudden decline in the trailing year average for new home sale prices is that they peaked in December 2017, which has now dropped out of the trailing twelve month average calculation.

The primary factor behind that development is the rapid rise of mortgage rates in the U.S. during 2018, which rose nearly a full percentage point from November 2017 through November 2018 before dropping in December 2018, following the Federal Reserve's sudden decision to back off its established policy of steadily hiking interest rates, after one last hike in December 2018. The following chart shows 30-year conventional mortgage rates from January 2000 through December 2018.
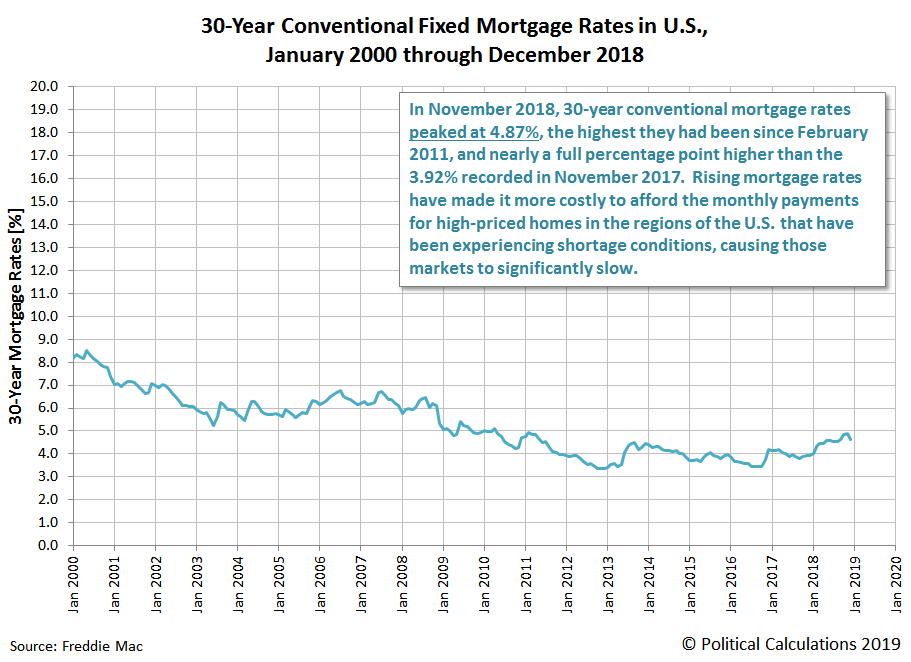
While in historical context, mortgage rates would appear to be low, it is important to note that in rising from 3.9% in November 2017 to 4.9% in November 2018, the amount of interest that a home buyer would need to pay in their first year of home ownership would have increased by roughly 27%.
Here's how that math works. Someone taking out a 30-year mortgage for $250,000 at 3.9% with payments starting in November 2017 could expect to have a monthly payment of $1,179.17, where they would pay a total of $9,670.49 in interest during their first year of mortgage payments.
But if the interest rate they had to pay for the same size loan was 4.9%, their monthly payment would rise to $1,326.82, a 12% increase over the monthly payment with mortgage rates a point lower, where they would pay a total of $12,166.40 just in first year interest for the same amount of borrowed money, a 27% increase over the $9,670.49 they would have paid with mortgage rates set at 3.9%.
That's what happened across much of the U.S. housing market during 2018, where the aggregate transaction value for existing home sales and for new home sales went on to peak in March 2018, lagging behind the peak in mortgage rates by several months as might be expected for major transactions like home purchases as it took time for the market's momentum to reverse.
There is a bright side in these developments. In making the monthly payments for home ownership so much more expensive, 2018's rising mortgage rates have primarily affected the top end of the real estate market in the U.S., which has negatively impacted the real estate market in the regions that have been experiencing shortage conditions for homes, which also have some of the highest home prices in the nation.
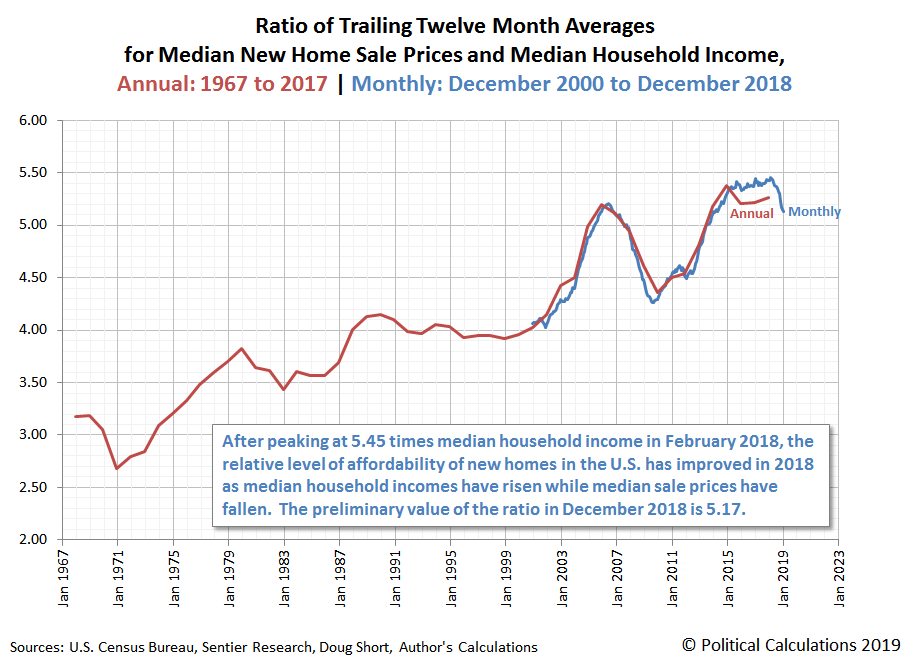
Home prices have responded in these regions by deflating which, as median household incomes have continued to rise in 2018, means that new homes have been becoming relatively more affordable, following their peak in unaffordability in February 2018.
There's a lot more going on across the U.S.' various local real estate markets that also contributes to what we're seeing in the national data, but 2018's rising mortgage rates go a long way toward explaining why so many homebuyers began steering away from high-priced houses during 2018, particularly in those areas that have very high escalations in home prices. We'll be exploring the real estate market in different regions in the U.S. later in the month.
References
U.S. Census Bureau. Median and Average Sales Prices of New Homes Sold in the United States. [Excel Spreadsheet]. Accessed 5 March 2019.
Freddie Mac. 30-Year Fixed Rate Mortgages Since 1971. [Online Database]. Accessed 5 March 2019.
Disclaimer: Materials that are published by Political Calculations can provide visitors with free information and insights regarding the incentives created by the laws and policies described. ...
more

