Richmond Fed Manufacturing: Soft Growth In January
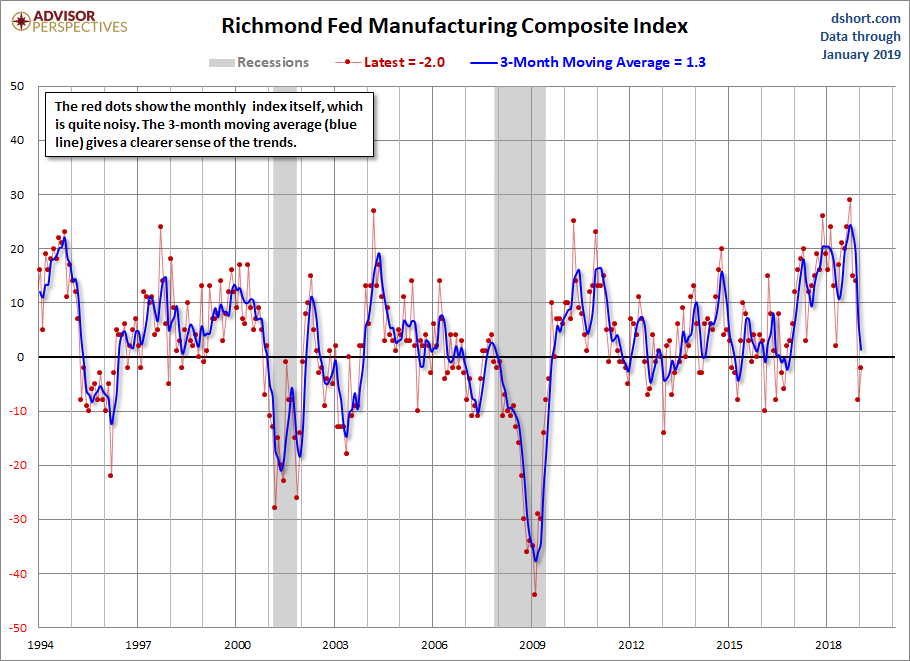
Today the Richmond Fed Manufacturing Composite Index increased to -2 for the month of January, up from last month's -8. Investing.com had forecast -6. Because of the highly volatile nature of this index, we include a 3-month moving average to facilitate the identification of trends, now at 1.3, which indicates expansion. The complete data series behind today's Richmond Fed manufacturing report, which dates from November 1993, is available here.
Here is a snapshot of the complete Richmond Fed Manufacturing Composite series.
Here is the latest Richmond Fed manufacturing overview.
Fifth District manufacturing activity was soft in January, according to the latest survey from the Richmond Fed. The composite index rose from −8 in December to −2 in January but continued to indicate weak growth. The rise from December came from increases in the component indexes of employment and shipments, although the shipments index remained negative. The third component, new orders, dropped to −11, its lowest reading since June 2016. Meanwhile, the index for backlog of orders fell to −21, its lowest reading since May 2009. However, manufacturers remained optimistic that conditions would improve in the coming months.
Survey results indicated continued growth in employment and wages in January, but firms still struggled to find workers with the skills they need. Respondents expected this struggle to continue, along with employment and wage growth, in the near future.
The growth rate of prices paid by survey respondents fell in January, but continued to outpace that of prices received, which held steady. Firms expected growth to slow for both prices paid and prices received in the next six months. Link to Report
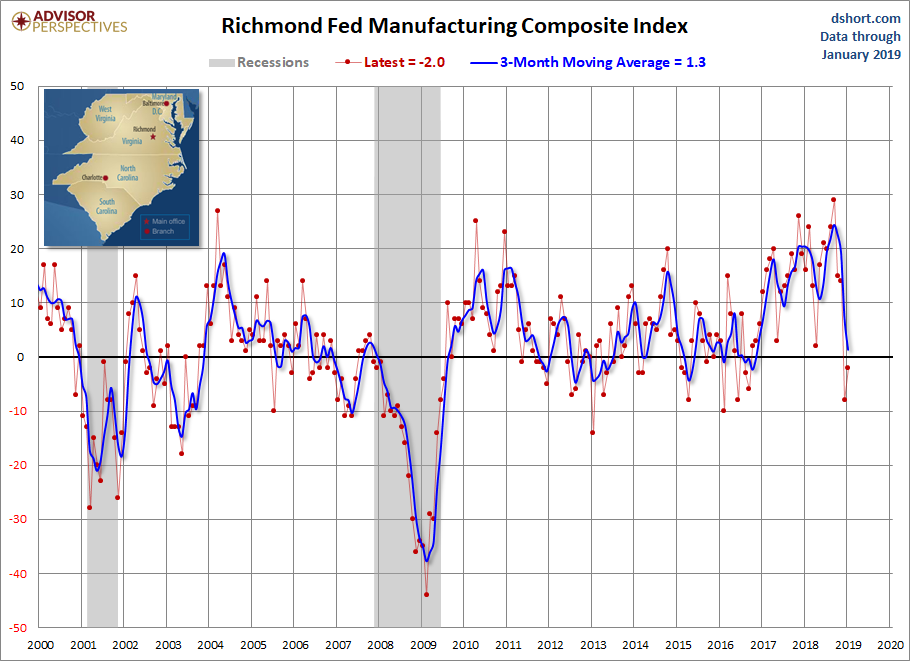
Here is a somewhat closer look at the index since the turn of the century.
Is today's Richmond composite a clue of what to expect in the next PMI composite? We'll find out when the next ISM Manufacturing survey is released (below).

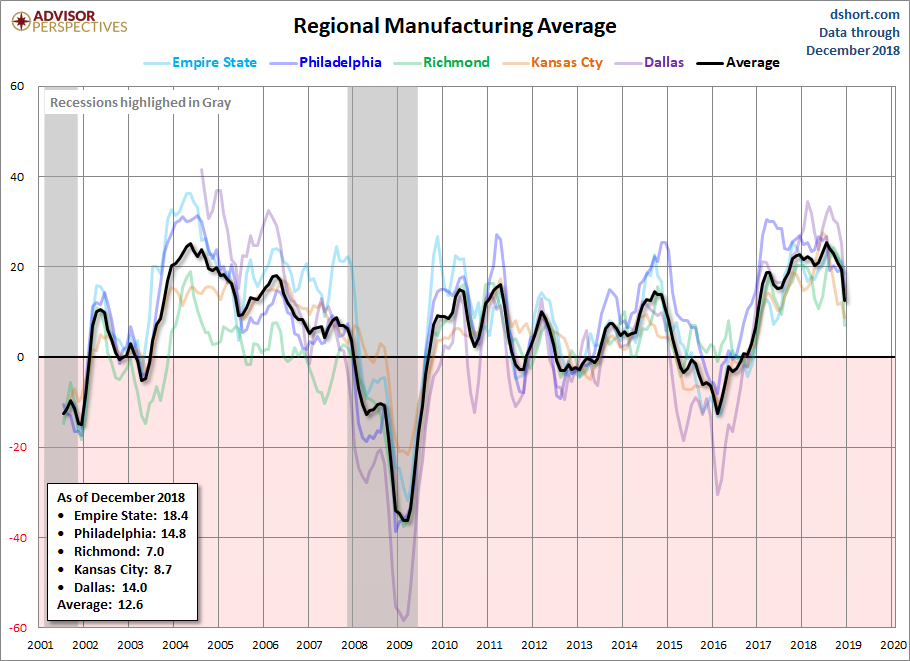
Let's compare all five Regional Manufacturing indicators. Here is a three-month moving average overlay of each since 2001 (for those with data).

Here is the same chart including the average of the five.