
Retail Sales Data Gives More Ammo To Those Fearing Recession
Thursday’s retail sales data likely poured more gasoline into the recession-fear fire. The cycle is getting long in the tooth. Risks are rising. The expansion has lasted for nearly a decade. Contraction is just a matter of when not if.
Talk of a US recession is on the rise. The question obviously is not if it will occur but when. The cycle is long in the tooth – nearly a decade-long. Great Recession ended in June 2009. It was partly due to this fear that grossly overbought US stocks took it on the chin in October through December last year.
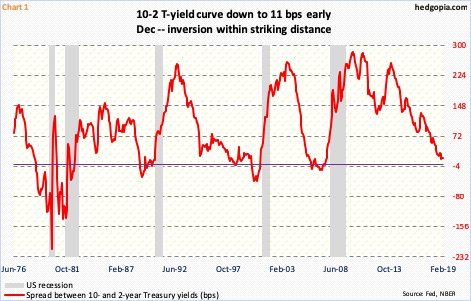
Persistent decline in the Treasury yield curve also made markets nervous. On December 11 last year, the spread between two- and 10-year yields shrank to 11 basis points, which was the lowest since June 2007 (Chart 1).
Historically, inversion does not bode well for the economy. An inverted yield curve means that short-term rates are higher than their long-term peers. This happens as demand for longer-term notes/bonds goes up because investors are pessimistic about the economy’s short-term prospects.
Most macro data points have been in deceleration in the past several months. In 2Q18, real GDP expanded 4.2 percent, followed by a 3.4-percent increase in 3Q. As of February 14, the Atlanta Fed’s GDPNow model is forecasting growth of 1.5 percent in 4Q.
The jobs picture continues to be the shining light, with the creation last year of 2.67 million non-farm jobs. But even here, some hairline cracks are appearing.
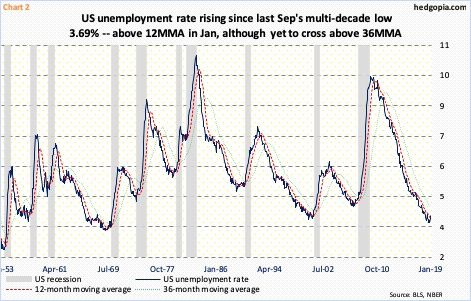
The unemployment rate has been rising since reaching 3.69 percent last September, which was the highest since 3.53 percent in December 1969. Jeff Gundlach’s recession indicator has not fully kicked in yet, but risks are rising. The unemployment rate was four percent in January, crossing above the 12-month moving average of 3.88 percent. This was the first crossover since June 2007 (Chart 2). It is yet to cross above the 36-month moving average. Along the same lines, the 12- and 36-month crossover has not yet occurred, although historically this takes place well into the economy has begun contracting.
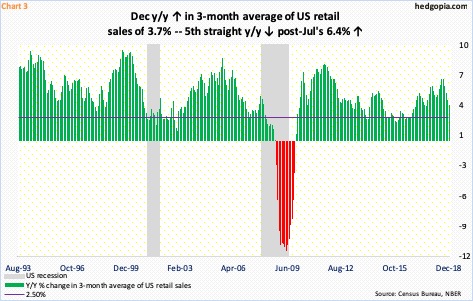
Amidst this, December’s retail sales – out on Thursday – likely poured more gasoline into the recession-fear fire. Sales contracted 1.2 percent month-over-month to a seasonally adjusted annual rate of $505.8 billion. Year-over-year, sales rose 2.3 percent – quite a deceleration from the 6.6-percent pace last July.
Monthly data tends to be volatile. Chart 3 uses a three-month moving average, which shows a similar decelerating trend. On this basis, December sales rose 3.7 percent y/y. This was the fifth consecutive y/y decline post-last July’s 6.4-percent expansion.
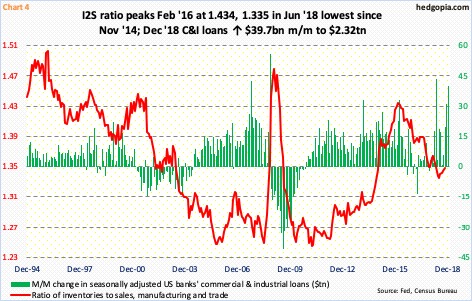
If December’s soft retail sales is not a one-month aberration, then inventories are worth watching going forward. This is particularly so as lending has picked up in recent months.
Last December, US banks’ commercial and industrial loans jumped $39.7 billion m/m to $2.32 trillion (SAAR). Momentum picked up since last September.
Concurrently, the ratio of inventories-to-sales in manufacturing and trade bottomed at 1.34 last June, rising to 1.35 by October. Looking at the spike in C&I loans of late, it is possible inventories are building. Hence the significance of series like retail sales and the need for downward momentum to stop. Else, a crossover between the unemployment rate and its 36-month moving average is just a matter of time.
Disclaimer: This article is not intended to be, nor shall it be construed as, investment advice. Neither the information nor any opinion expressed here constitutes an offer to buy or sell any ...
more

