
Regulation Will Evict This Firm’s Micro-Bubble Expectations
Given the spike in disregard for fundamental risk exemplified by the GameStop (GME) frenzy, we continue our micro-bubble winners and losers theme to help investors assess fundamental risks. This week’s winner/loser pair is Hyatt Hotels (H) $74/share) as a Long Idea and Airbnb, Inc. (ABNB) $195/share as the Danger Zone pick.
New Micro-Bubble Loser: Airbnb (ABNB) vs. New Micro-Bubble Winner: Hyatt Hotels (H)
We originally featured Airbnb in November 2020 prior to its IPO and updated our report with pricing information here and here. Given ABNB’s GME-like rise to ~$195/share, the stock is clearly in a micro-bubble. In contrast, Hyatt Hotels remains a best-in-class hotel operator with expectations for future growth in cash flows that pale in comparison to Airbnb. We originally made Hyatt a Long Idea in May 2020 and reiterated it in January 2021.
Mounting Regulatory Challenges Could Crush Revenue & Inventory
As more cities and states impose stricter regulations on Airbnb hosts, Airbnb could lose inventory and see slower, if not declining, revenue growth. For instance in 2018, New York state effectively banned Airbnb from New York City, the firm’s largest market. With the swipe of a pen, 51% of listings and two-thirds of revenue for the New York city area were estimated to come from illegal listings during 2014-2017.
NYC’s new regulations expose hosts to fines up to $2,500 per day and Airbnb up to $7,500 per illegal listing. For hosts, these fines could tally upwards of $1.1 million a month in NYC alone if they occur as often as similar safety code violations on businesses and rentals not covered by NYC’s short-term rental bans. These fines could deter hosts and significantly reduce listings available in NYC. Boston and L.A. have instituted similar regulations that result in daily fines on both hosts and Airbnb for illegal listings.
Cash Burner vs. Cash Earner
We prefer firms that consistently generate cash over firms that burn cash. Airbnb burned $721 million in FCF in 2019 and the firm’s trailing-twelve-month FCF sits at -$711 million. In contrast, Hyatt has generated $3.3 billion (47% of market cap) in cumulative free cash flow over the past five years, per Figure 1.
Figure 1: Airbnb vs. Hyatt: Five-Year Cumulative Free Cash Flow
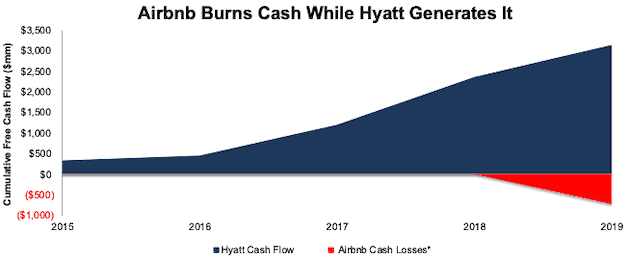
Sources: New Constructs, LLC and company filings.
*Airbnb has only reported one year of FCF in 2019 given its limited history of financial filings since its IPO.
Airbnb’s Valuation Implies 12 Times Higher Revenue Than Hyatt by 2029
We also prefer stocks with more conservative expectations for future revenue growth over those with overly optimistic future growth expectations. Figure 2 compares the TTM revenue for Airbnb, Hyatt, combined Marriott (MAR), Hilton (HLT), and Hyatt revenue to the 2029 implied revenue by each firms’ valuation, as quantified by our discounted cash flow (DCF) model. Per Figure 2, the implied revenue in 2029 baked into Airbnb’s valuation is 12 times higher than the 2029 revenue implied by Hyatt’s valuation and 27% higher than the combined 2029 implied revenue of Marriott, Hilton, and Hyatt.
Figure 2: ABNB’s Implied Revenue Is Ridiculously High
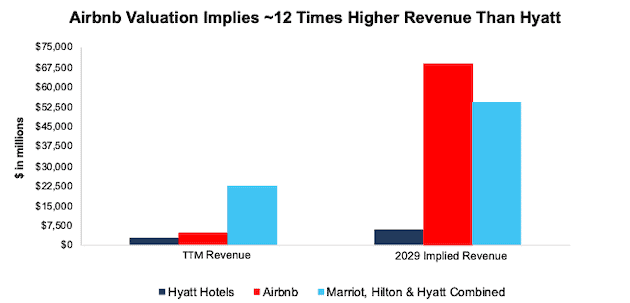
Sources: New Constructs, LLC and company filings.
The Market Expects Much More Revenue & Profit Growth From Airbnb Than Hyatt
Below we use our DCF model to further analyze the future revenue and profit growth expectations baked into Airbnb’s and Hyatt’s current stock prices.
To justify its current price of ~$195/share, Airbnb must:
- Immediately improve its NOPAT margin to 10%, compared to -8% TTM
- A 10% NOPAT margin would equal Trip.com’s (TCOM), a middle-of-the pack performer among peers, 2019 NOPAT margin
- Grow revenue by 31% compounded annually for the next 10 years.
In this scenario, Airbnb would earn nearly $69 billion in revenue in 2029, which is nearly 2x the 2019 (pre-COVID-19) revenue of Marriott, Hilton, and Hyatt combined.
One the other hand, market expectations for Hyatt, the more established and profitable firm, are significantly lower. The expectations baked into its current price of $74/share assume:
- NOPAT margin permanently falls to 7%, which equals the company’s average since 2009. For reference, TTM NOPAT margin is 8% and 2019 NOPAT margin was 14%.
- Revenue grows by just 1% compounded annually for the next 10 years. This assumption includes revenue falling by 53% in 2020, growing by 57% in 2021, 21% in 2022 (equal to consensus) and 3.5% a year each year thereafter.
Figure 3 compares Airbnb’s and Hyatt’s implied revenue in the above scenarios to their historical revenue and clearly illustrates the disconnect between the expectations for future cash flow growth baked into both ABNB and H. For reference, we also plot the combined TTM revenue of Marriott, Hilton, and Hyatt, the three largest (by revenue) hotel operators under coverage.
Figure 3: Airbnb vs. Hyatt: Revenue Growth Expectations vs. Historical Revenue
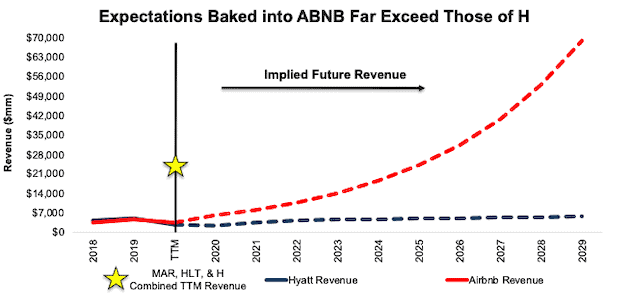
Sources: New Constructs, LLC and company filings
ABNB Valuation Implies 14 Times Greater Share of SAM than Hilton, Marriott, and Hyatt Combined
At Airbnb’s TTM take rate, or the revenue generated per gross booking value (total sales on the platform), the scenario above implies ABNB achieves $503 billion in gross booking value (GBV) in 2029.
To put this implied achievement into context, we analyze its implications on Airbnb’s serviceable addressable market (SAM), which the firm estimates at $1.5 trillion. As shown in Figure 4, Airbnb’s current valuation implies it will grow its GBV from 2% of its SAM in 2019 to 34% in 2029. This expectation seems highly unlikely given how fragmented the lodging market is and the fact that three of Airbnb’s largest competitors, Hyatt, Marriott (MAR), and Hilton (HLT) held a combined share of just 2.4% of the SAM in 2019. In other word’s Airbnb’s implied share of its SAM in 2029 is over 14 times larger than the combined 2019 share of its three largest competitors.
Figure 4: ABNB Current vs. Implied Share of Its Serviceable Addressable Market
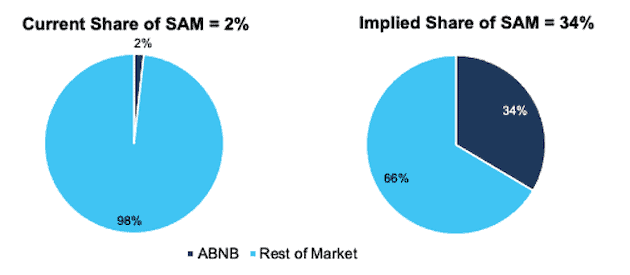
Sources: New Constructs, LLC and company filings
How Low Could ABNB Go?
Even if Airbnb can achieve a 10% NOPAT margin (compared to -8% TTM) and grow revenue by 16% compounded annually (equal to average consensus estimates through 2029) for the next decade, the stock is worth just $49/share today – a 75% downside, per Figure 5.
For reference, Airbnb’s NOPAT in this scenario would reach $2.1 billion in 2029, which would be 26% greater than Marriott’s 2019 NOPAT and 194% greater than Hyatt’s 2019 NOPAT.
Figure 5: Airbnb Has Large Downside Risk: DCF Valuation Scenario
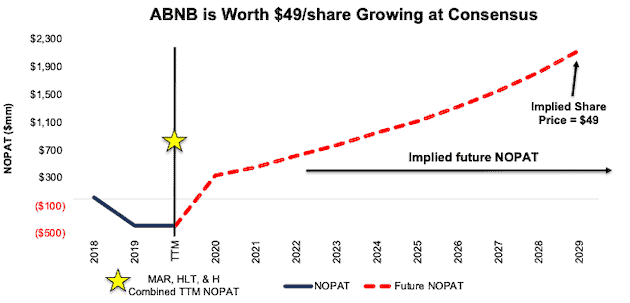
Sources: New Constructs, LLC and company filings
This scenario (and the one above) also assume Airbnb is able to grow revenue, NOPAT and FCF without increasing working capital or fixed assets. This assumption is unlikely but allows us to create best-case scenarios that demonstrate how high expectations embedded in the current valuation are. For reference, Airbnb’s invested capital increased from $17 million in 2018 to $345 million TTM.
Profitability Vs. the Competition Creates Further Hurdles
Airbnb is significantly less profitable than Hyatt and other peers. While Airbnb’s business model boasts impressive invested capital turns of 17.5, its negative NOPAT margin results in a return on invested capital (ROIC) of -139%. See Figure 6.
Figure 6: Hyatt vs. Airbnb Fundamental Metrics Comparison

Sources: New Constructs, LLC and company filings.
Per Figure 7, only five firms in the hotel/resort/lodging booking industry have worse TTM NOPAT margin than Airbnb. In 2019, Airbnb’s NOPAT margin ranked last among the firms in Figure 7, which include firms Airbnb lists as competitors in its S-1, such as Alphabet (GOOGL), Booking Holdings (BKNG), Trip.com (TCOM), Expedia (EXPE), Marriott International, and Hilton Worldwide Holdings, as well as additional hotel operators under coverage.
Figure 7: Airbnb’s Profitability Vs. Peers: TTM
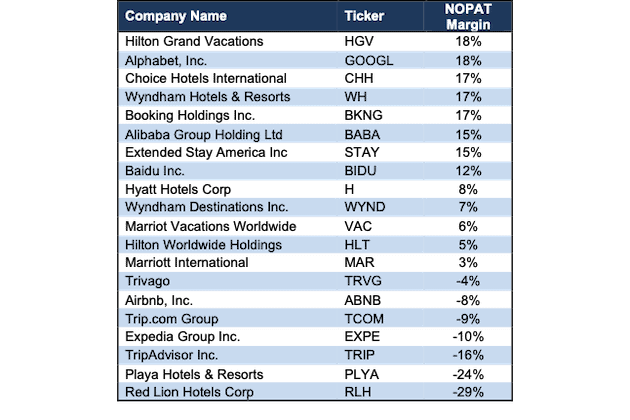
Sources: New Constructs, LLC and company filings.
Given above, and despite both firms facing significant secular headwinds in 2020, Hyatt, with its strong fundamentals and low expectations for future growth in cash flows offers much better risk/reward than Airbnb.
Not the Only Micro-Bubble in the Market
Below we provide a list of micro-bubble losers that should fall as the micro-bubbles in their valuation bursts, along with micro-bubble winners that should rise when the bubble bursts. Figure 8 pairs our micro-bubble winners with their micro-bubble losers.
Figure 8: Micro-Bubble Winners & Micro-Bubble Stocks
| Micro-Bubble Winners | Micro-Bubble Losers | Report Date |
| Hyatt Hotels Corp (H)* | Airbnb, Inc. (ABNB)* | 2/10/21 |
| Williams-Sonoma Inc. (WSM) | Wayfair, Inc. (W) | 2/3/21 |
| Sysco Corporation (SYY) | DoorDash, Inc. (DASH) | 1/27/21 |
| Alphabet, Inc. (GOOGL) | GoDaddy Inc (GDDY) | 9/26/18 |
| Microsoft Corporation (MSFT) | Dropbox Inc. (DBX) | 9/26/18 |
| General Motors Co (GM) | Tesla Inc. (TSLA) | 8/16/18 |
| The Walt Disney Company (DIS) | Netflix Inc. (NFLX) | 8/16/18 |
| Oracle Corporation (ORCL) | Salesforce.com Inc. (CRM) | 8/16/18 |
| Walmart, Inc. (WMT) | Amazon.com Inc. (AMZN) | 8/16/18 |
Sources: New Constructs, LLC and company filings.
*New to the list as of this report.
This article originally published on February 10, 2021.
Disclosure: David Trainer, Kyle Guske II, and Matt Shuler receive no compensation to write about any specific stock, style, or theme.


