
Regardless If The Low Is In On S&P 500, Risk-On Attitude Missing — Weakness Brewing N/T
In the current bear market, the S&P 500 is down nearly 34 percent, which is the 8th worst out of 14 going back to 1929. It is too soon to say if THE low is in. After the March 23rd low, both bulls and bears have put their foot down. Small-caps in this regard are the one to watch. Bulls successfully defended February 2016 lows on the Russell 2000, but investors are yet to aggressively embrace risk-on.
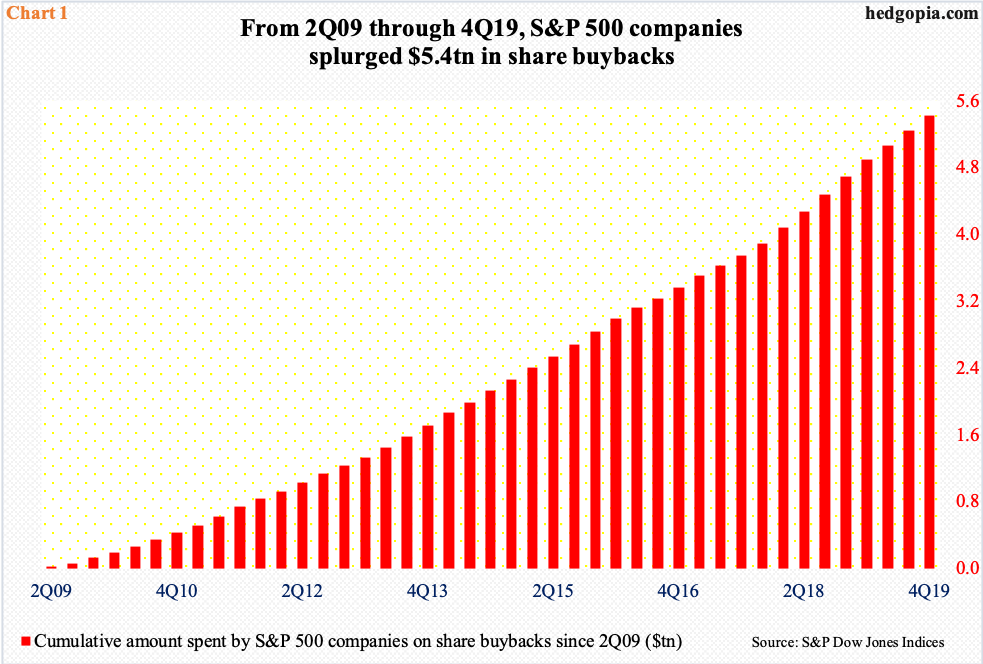
The bull market that ended on February 19th benefited immensely from share buybacks. In 2019, S&P 500 companies spent $728.7 billion on buying back their own shares. This followed record $806.4 billion in 2018.
Buybacks gained momentum as the bull market aged. Companies were buying more at higher prices. The bull began in March 2009. From 2Q09 through 4Q19, $5.4 trillion was spent on buybacks (Chart 1). Just to gain some perspective as to how massive this amount is, these companies earned $10.3 trillion out of operations during the period.
Amid the coronavirus-spurred disruptions to their business, scores of companies have already suspended dividends and share buybacks. Bed Bath & Beyond (BBBY), Brinker International (EAT) and Dave & Buster’s (PLAY) are some of the examples. Their numbers will only increase in months/quarters ahead.
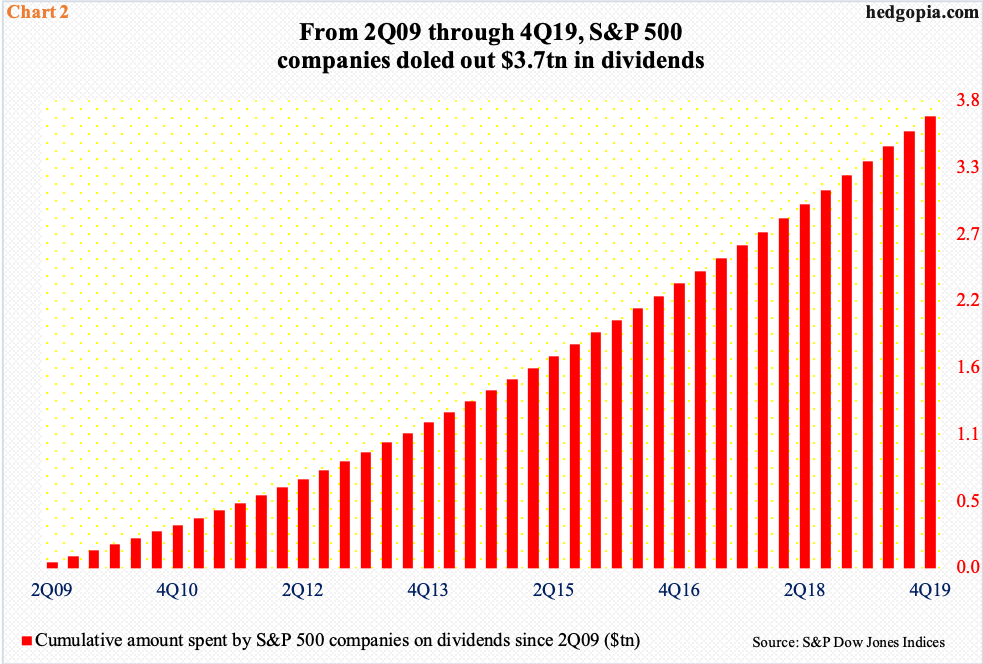
Like buybacks, these companies have been very generous with dividends. In 2019, they doled out $485.5 billion – a new record. Between 2Q09 and 4Q19, dividend distribution cumulatively added up to $3.7 trillion (Chart 2).
Going forward, the question is not if payouts will face a haircut because it will, the question is of magnitude. The $2-trillion coronavirus relief act that was passed last month requires participant companies to suspend buybacks and dividends until 12 months after the loan is repaid in full.
This is now developing into a huge headwind for stocks.
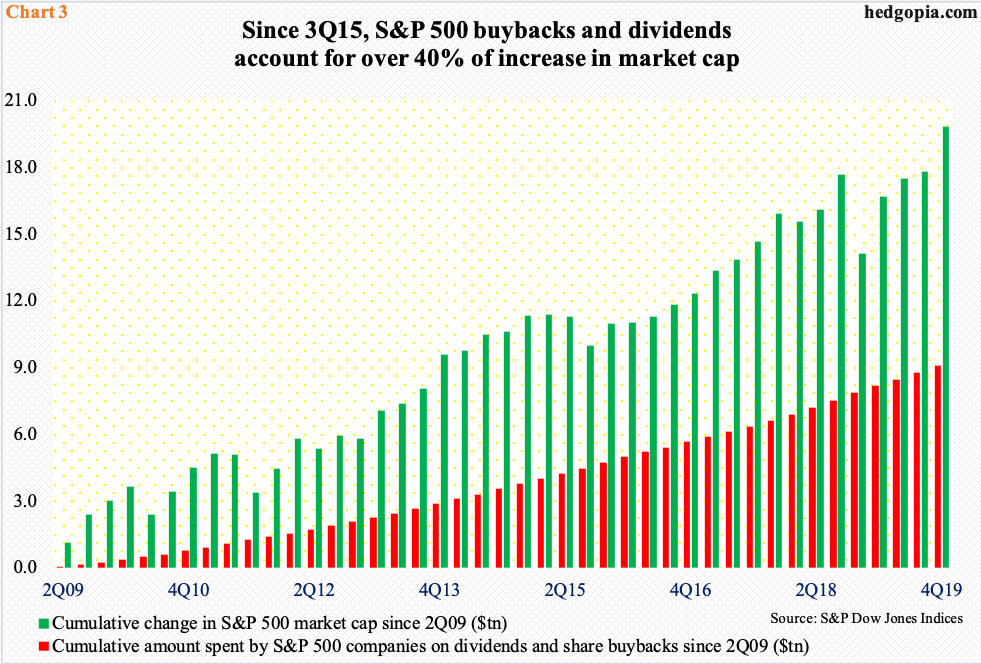
Chart 3 compares the cumulative increase in S&P 500 dividends and buybacks during 2Q09-4Q19 to the rise in the market cap of constituent companies. During the period, $9.1 trillion was spent on dividends and buybacks, while the market cap increased by $19.8 trillion. This was 45.8 percent!
Even more shocking, the amount spent by these companies on dividends and buybacks was nearly 100 percent of operating earnings. What was going on was clearly not on a sustainable path. Momentum is now set to reverse.
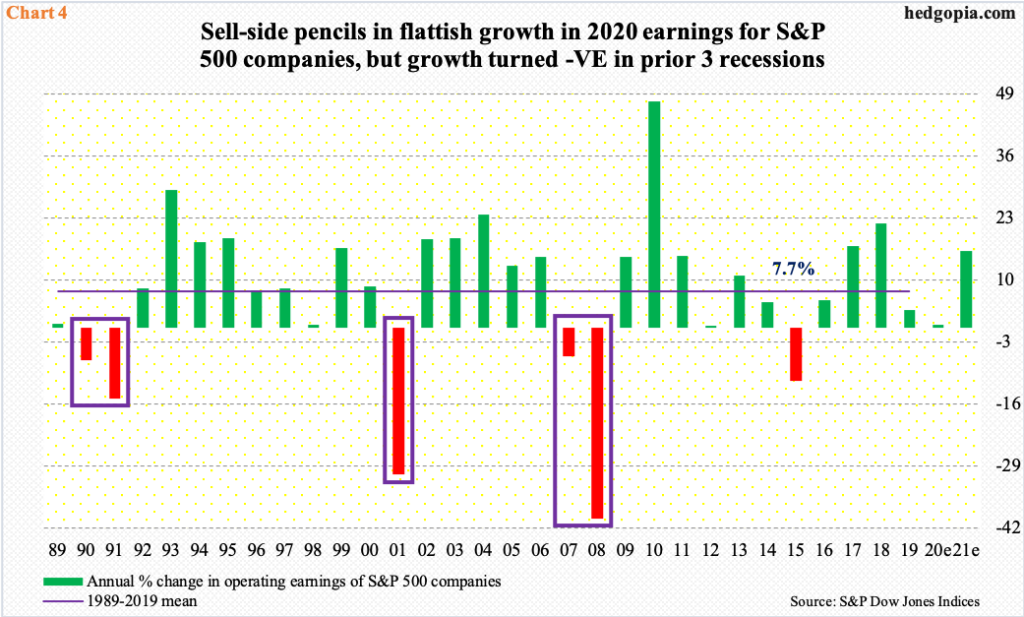
The sell-side has begun to cut their estimates. As of March 31st, this year’s operating earnings estimates for S&P 500 companies stood at $157.91. In March last year, they were as high as $186.36. The downward revision has been steep, but the fact remains that even after this, 2020 estimates are essentially unchanged from last year’s. In 2019, these companies rang up $157.12. There is still a lot of optimism built into these estimates.
In the prior three recessions, earnings growth went negative – down 6.9 percent in 1990 and 14.8 percent in 1991, down 30.8 percent in 2001, and down 5.9 percent in 2007 and 40 percent in 2008 (boxes in Chart 4).
It is anyone’s guess as to what kind of a contraction earnings will face this year. There is a lot of uncertainty around the virus and the disruptions it has caused and might cause going forward.
The U.S. economy is in contraction mode. It has suddenly come to a halt, with non-farm payroll down 701,000 in March – the first negative month since September 2010. The survey was taken before the full force of the crisis hit. This just offers a window into what is to come.
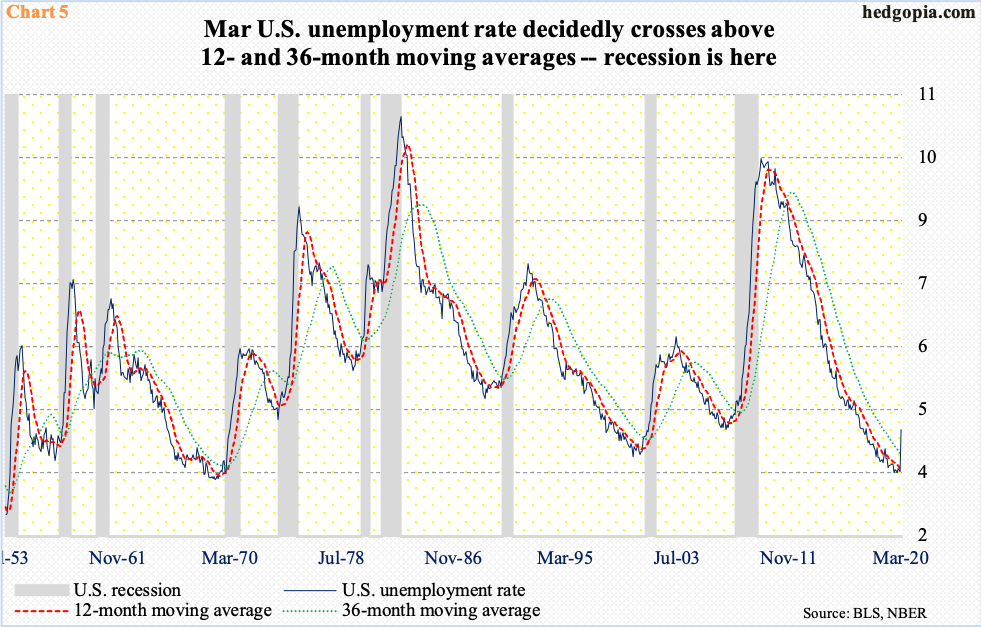
Jeffery Gundlach’s (DoubleLine Capital) recession indicator just flashed one (Chart 5). In each of the 10 recessions going back to 1953, as recession begins, the U.S. unemployment rate has tended to cross above its 12- and 36-month moving averages. This occurred in March. The unemployment rate in the month rose to 4.38 percent. Last December’s 3.5 percent was the lowest since 3.49 percent in June 1969. Good times do not always last. This metric has a long way to go on the upside.
It is too soon to say if stocks already priced this in, but they have taken quite a hit. From February 19th to March 23rd, the S&P 500 large-cap index collapsed 35.4 percent intraday. The speed at which this took place reflects investor fears around the economy, earnings, and the aforementioned buybacks and dividends.
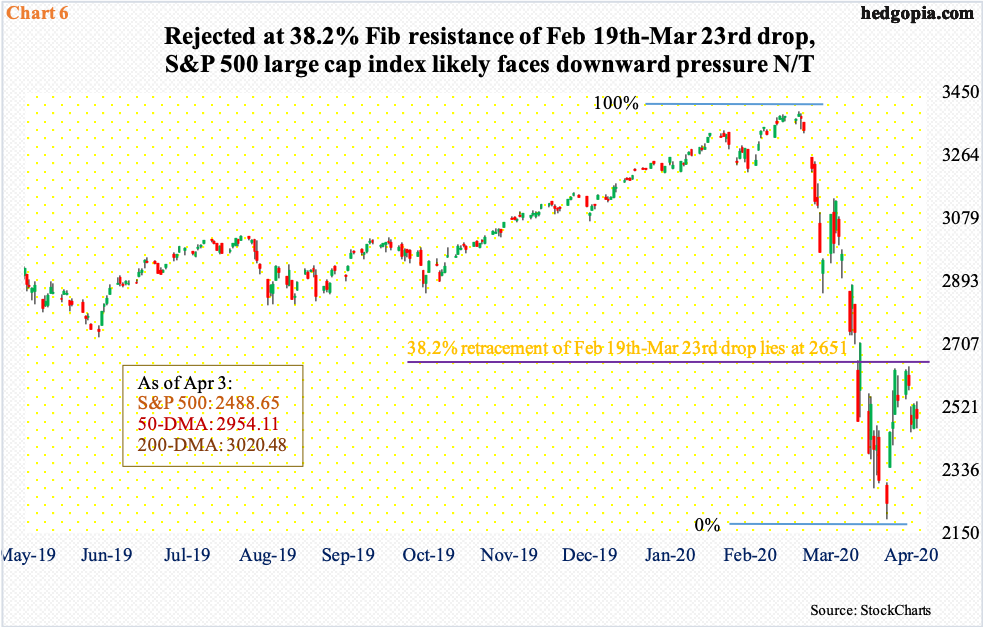
After the March 23rd low, both bulls and bears seem to be putting their foot down. A 38.2-percent Fibonacci retracement of the 24-session decline rests at 2650.89 (Chart 6). Rally attempts in the past couple of weeks were persistently sold at 2630s, even as the 10- and 20-day moving averages are itching for a potentially bullish crossover.
Medium-term, several metrics from sentiment to options-related are grossly oversold. The weekly has lots of room to rally. Near-term, however, the daily has room to head lower. This will change should bulls convincingly take out 2630s. This will then raise the odds of a test of 2850s.
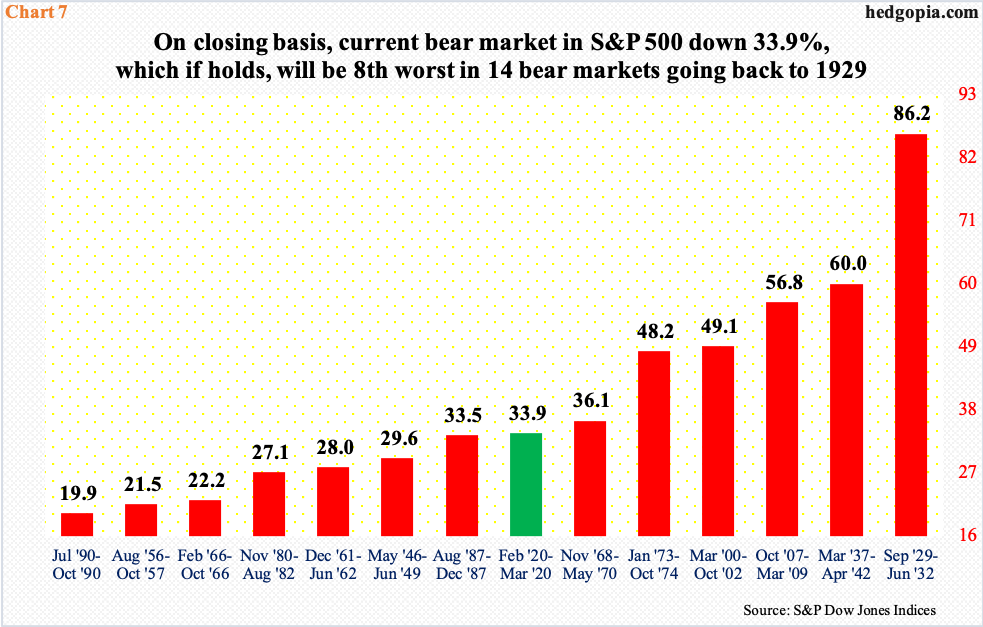
If it so happens that the March 23rd closing low of 2237.40 (intraday 2191.86) remains intact before a new bull begins, this will be the shortest bear market going back to 1929 – a mere 1.1 months.
That said, in terms of decline, it already ranks as the 8th worst. On a closing basis, the S&P 500 is down 33.9 percent. Chart 7 also humbly reminds us how bad bear markets can get. The Great Depression bear market cost 86.2 percent.
It is futile to try to guess how bad it could get this time around or if the bear-market low is in. What path the virus will take is impossible to model. We know this much. Thus far, despite the rally off the March lows, investor preference has been for large-caps. Small-caps are yet to get going.
Last week, the Russell 2000 small-cap index tumbled 7.1 percent – much worse than its U.S. peers including large-caps. Historically, once investors begin to realize things are beginning to stabilize, they gravitate toward small-caps. That risk-on attitude is missing right now.
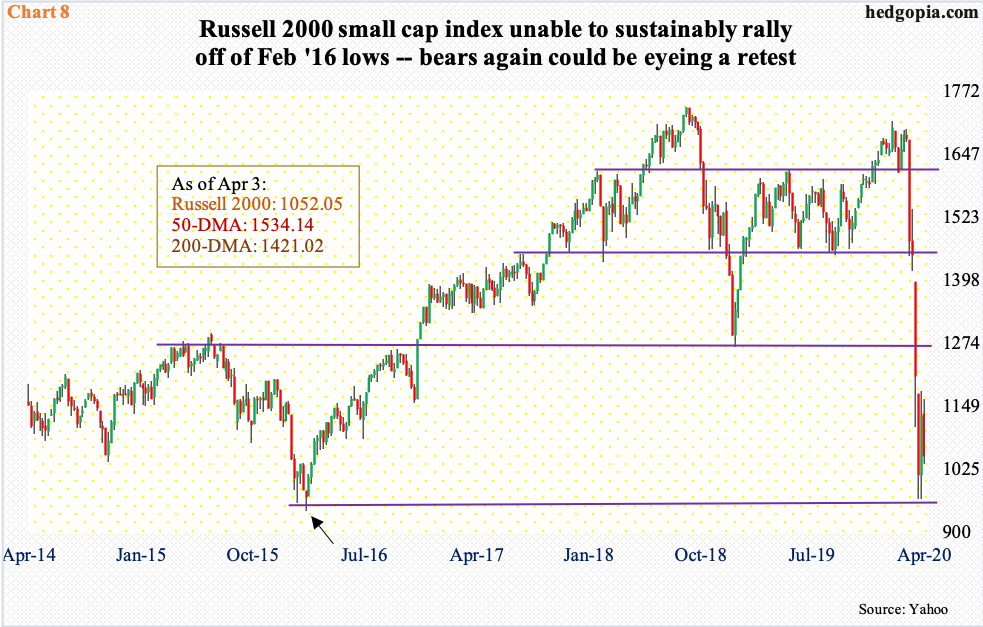
From bulls’ perspective, the good thing is that in the weeks of March 16th and 23rd, the Russell 2000 dropped to essentially test – successfully – the lows from February 2016 (arrow in Chart 8). A decisive breach of this crucial support will be an indication that markets are beginning to price in a lot worse. Unless that happens, bulls deserve the benefit of the doubt. Near-term, however, weakness could be brewing.


