
Recovery In Stocks Continues As The Fed And China Become More Cooperative
There is a stock market adage that says, “as goes January, so goes the year”. Well, if that comes true this year, we are in for some robust gains, as stocks just enjoyed the strongest January since 1987 (when it rose +13.2%). For the full month of January, the S&P 500 gained +8.0% (and S&P mid and small caps were even stronger at around +10.5%). Meanwhile, after a dismal 2H2018 in which Sabrient’s cyclicals-heavy portfolios trailed the broad market in the wake of a fear-driven defensive rotation that began in June, our 12 monthly all-cap Baker’s Dozen portfolios from 2018 handily outperformed by gaining an average of +11.8% for the full month of January (and +19.7% since the low on Christmas Eve through 1/31, versus +15.2% for the SPY), and our actively-managed SMA portfolio (which holds 30 GARP stocks) gained +13.2%. Fundamentals seem to matter again, and institutional fund managers and corporate insiders have been suddenly scooping up shares of attractive-but-neglected companies in what they evidently see as a welcome buying opportunity.
On the other hand, it’s pretty clear to me that 4Q2018 was unnecessarily weak, with the ugliest December since the Great Depression, selling off to valuations that seem more reflective of an imminent global recession and Treasury yields of 5%. So, some might argue that January’s big rally was just a temporary bounce from massively oversold conditions – a case of “righting the ship” back to more appropriate valuations – and as such is giving us a little indication about the balance of the year.
My view is more on the bullish side. When you combine earnings beats and stable or rising forward guidance with price declines, it sure seems to me that the worst is behind us, as investors recognize the opportunities before them and pay less attention to the gloomy news headlines and fearmongering commentators. Moreover, I expect to see a renewed appreciation for active management and a return to a more selective stock-picker’s market, with a rising stock market fueled by a de-escalation (or preliminary resolution) to the trade war with China and a more patient and accommodative Fed. In fact, as I said at the start of the year, I think the S&P 500 will finish the year with a gain in the 20-25% range – but savvy stock selection could produce even better returns. However, please be cognizant of 2018’s lesson that volatility is not dead, so try not to be alarmed when we encounter bouts of it over the course of the year.
Market Commentary:
The gloomy investor sentiment last year was primarily due to the escalating trade war with China and the Federal Reserve seemingly hellbent on raising rates and withdrawing liquidity from the financial system. This led to a defensive risk-off rotation in June and ultimately to the worst year for stocks since 2008. But throughout a rough 2H2018, the consensus positive outlook among the analyst community really hadn’t changed much. Yes, the forward P/E of the S&P 500 was destined to come down from the 18.5x level it displayed at the start of 2018, but falling all the way down to 13.6 in December was way overdone, in my view, given sub-3% interest rates and 10%+ expected earnings growth. To me, this was yet another case of investors ignoring the positive fundamentals – and historically such behavior has proven to be a transitory event, as stock prices over time eventually reflect fundamentals.
But that was little consolation for some of the brightest and most successful valuation-driven investors last year. David Einhorn of long/short Greenlight Capital said that “nothing went right” as his fund lost 34%. Cliff Asness of quant-based AQR Capital called 2018 a “George Costanza market,” in reference to the Seinfeld TV show episode in which George found success by doing everything the opposite of what he would normally do.
Indeed, holding smaller caps and cyclical stocks displaying strong growth forecasts, solid earnings quality, and attractive forward valuations is normally the profitable thing to do when the economy is growing and interest rates are low, but it sure didn’t work very well at all in 2H2018. However, once the tax-loss selling exhausted itself on the Christmas Eve “capitulation day,” a V-shaped recovery launched, and January’s impressive performance served as an encouraging reminder that timeless growth-at-a-reasonable-price (GARP) investing is far from dead, as most of Sabrient’s portfolios have outperformed – many by a wide margin.
For the full month of January, the S&P 500 large caps (SPY) gained +8.0%, Nasdaq 100 (QQQ) +8.6%, S&P 600 small caps (SLY) +10.5%, and S&P 400 mid-caps (MDY) +10.6%. As for sector performance within the S&P 500 in January, S&P Dow Jones Indices reported that Industrials and Energy were the top-performing sectors at +11.4% and +11.1%, respectively, while Utilities and Healthcare were the worst at +3.4% and +4.8%. Oil gained 20% and is back up to $55/barrel. Interestingly, Real Estate was strong in January at +10.8%, but also was by far the best performer over the past 3 months (+8.4%) and second only to Utilities over the past year (+10.4%).
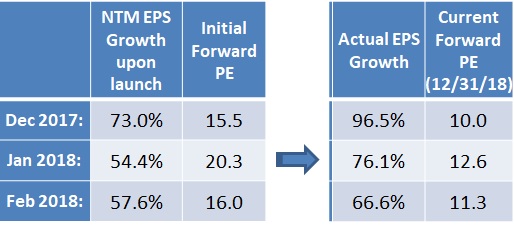
Again, after underperforming during a difficult 2H2018 in which investors ignored fundamentals, Sabrient’s 12 monthly all-cap Baker’s Dozen portfolios from 2018 gained an average of +11.8% for the full month of January. It’s no surprise to me why our cyclicals-heavy Baker’s Dozen portfolios would outperform. The table below shows for three sample portfolios (that have terminated or will soon terminate): 1) the attractive aggregate forward earnings expectations upon launch, 2) the earnings growth that actually occurred over the ensuing 12 months, and 3) how each portfolio’s forward P/E looks today. For example, the January portfolio launched with an expectation of 54% aggregate EPS growth while the actuals came in much better at nearly 76%, but at the same time the forward P/E fell from 20.3 at launch down to 12.6 today. In other words, the aggregate growth expectations of the portfolio upon launch came in nearly 40% better while the forward P/E fell nearly 40%. That’s not the way it normally works when the companies you select produce even better than anticipated and maintain solid forward guidance.
(Click on image to enlarge)
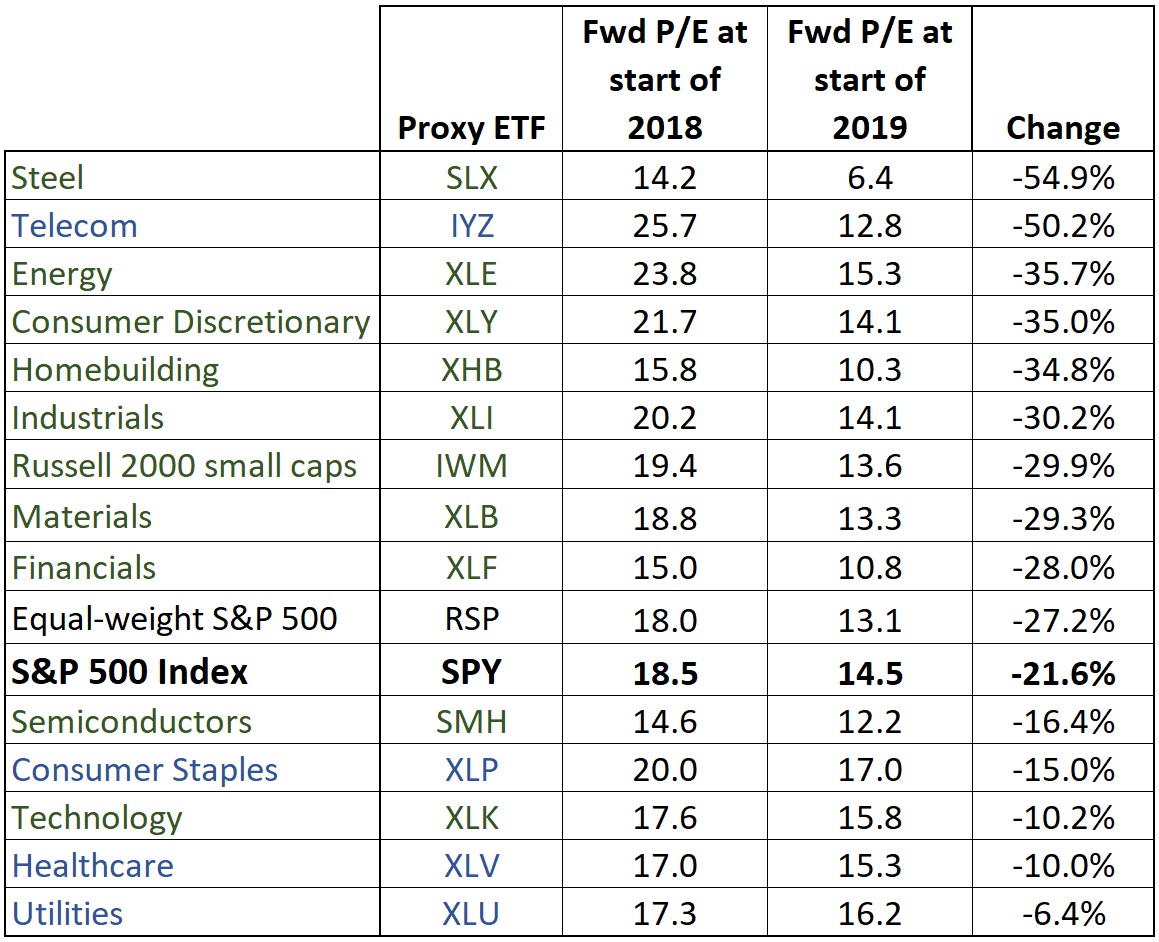
The following table shows how the forward P/E ratios for various market segments changed from the beginning of 2018 until the end. You can see that cyclical sectors took the brunt of the selling despite little change in the forward expectations. The Steel industry, represented by VanEck Vectors Steel (SLX), in particular, was absolutely shunned, as its forward P/E fell -55% from 14.2x down to 6.4x. There was no logic in that, other than a fear that escalating trade wars would soon lead to global recession and force the analyst community to slash earnings estimates – which has not happened, of course.
(Click on image to enlarge)
The selloff in stocks during Q4 unsurprisingly led to a rotation of capital into bonds such that the 10-year Treasury yield fell below the 3.0% level to close the year at 2.69%. But even with the V-shaped recovery in stocks since 12/24, the 10-year yield hasn’t budged, as US bonds have attracted global investor capital. And why not? When you consider that the Fed seems unlikely to raise rates much further and given what other risk-free developed market 10-year bonds are yielding, like Germany at +0.18% and Japan at -0.012% (yes, that’s a negative rate for a 10-year investment), not to mention fears of a “hard Brexit,” US Treasuries are eminently appealing. The 10-year US T-note closed Monday at 2.72% while the 2-year closed at 2.54%, so, the closely-watched 2-10 spread is only 18 bps. However, the 3-month T-bill is at 2.38%, which implies a spread versus the 10-year T-note of 34 bps, which looks a little better.
Inflation remains quite modest, and the forward 5-year inflation indication from the TIPS market is about 1.6% (after peaking in May at over 2%). Moreover, strength in the dollar has moderated quite a bit, making life easier for US multinationals (earnings) and emerging market countries (debt), not to mention boosting the price of gold.
In the January FOMC meeting, the Fed’s “new normal” approach has seemed to transition from “autopilot” rate hikes and balance sheet reduction to “patience,” flexibility, and a commitment to data-dependence, given the economic and political environment. Now, Fed Chairman Powell says he would want to see a need for any further rate increases rather than a reason not to raise rates. Importantly, investors should not conclude from this fed funds pricing that the Fed has changed from an optimistic outlook to fears of a fragile economy or recession. Rather, the Fed simply has come to acknowledge what has been obvious to me all along, i.e., that it matters when interest rates rise on a heavily-indebted economy and liquidity is pulled out of the financial system, and for the foreseeable future the “neutral rate” is much lower than it was in prior economic cycles. The CME Group fed funds futures agree, placing only a 2.3% probability of another rate hike by January 2020, and in fact it also shows a 20% probability of at least one rate cut by then.
Looking ahead, conditions appear favorable, with unemployment at historical lows, wages rising, and consumer sentiment strong. The Employment Situation report on Friday blew away expectations of 158,000 new jobs to register 304,000, and the labor participation rate keeps rising. The IMF slightly reduced its global growth forecast to 3.5% from 3.7%, but it is still solid. China and EU countries are signaling the introduction of fiscal stimulus measures. Although the US economic growth rate also has slowed a tad (likely due to the trade war and associated reluctance of corporations to make large capital investment decisions), it continues to show no signs of imminent recession. During 2018, final Q1 GDP came in at a 2.0% annual rate, Q2 was 4.2%, and Q3 was 3.4%. Looking ahead, the Atlanta Fed’s GDPNow model (as of Feb 1) is forecasting 2.5% for Q4, while the New York Fed’s Nowcast model (as of Feb 1) forecasts Q4 at 2.6% and 2.4% for 1Q2019.
Unless recent Democratic-proposed legislation to restrict buybacks gains broad support, analysts think this will be another big year for share buybacks, with perhaps another $800 million allocated this year, according to JP Morgan (after nearly $1 trillion last year – of which only 14% was financed by debt). Buybacks improve valuations by decreasing outstanding shares, which boosts EPS (by reducing the denominator), which in turn lowers the P/E ratio (by increasing the denominator). Notably, the firm has observed that S&P 500 companies have spent $5 trillion on buybacks since 2009, which has boosted earnings by about 2%. In addition, Mergermarket reported that M&A activity totaled $3.5 trillion in 2018, which was the third-largest year on record, and new deals have continued to be announced so far this year.
Furthermore, Q4 corporate earnings have been looking strong, dividends are being increased, and corporate capital investment (at long last) has kicked into gear (and should accelerate even more once the trade war is resolved). According to FactSet, as of February 1, 46% of S&P 500 companies had reported, with 70% beating earnings estimates, and aggregate year-over-year EPS growth of 12.4%. Bespoke Investment Group observed that “Earnings triple plays this season (companies that beat EPS, beat revenues, and raise guidance) have averaged a huge one-day gain of 9.15% on their earnings reaction days,” which is well above the historical average of +5.32%. And keep in mind, the 12 months following a mid-term election is historically quite bullish, no matter who wins. Growth is expected to be highest this year in Consumer Discretionary, Industrials, and Financials, and in 2020 growth is expected to accelerate even more, led by Energy, Consumer Discretionary, Materials, and Industrials.
As my regular readers know, my view is that there may be several years remaining in this economic expansion, as earnings continue to grow while inflation stays modest. With the Fed committed to a more patient approach, I think that once the trade war with China is alleviated with some sort of agreement (e.g., tariffs lifted and some level of commitment by China to honor patents, scale back on government subsidies and forced technology transfers, and remove some obstacles to foreign investment), we should finally see the economy unleashed in supply-side fashion, as US companies further ramp up capital spending. Moreover, I expect forward guidance to be raised across the cyclical sectors and a continued risk-on rotation into equities (but again, not without bouts of volatility).
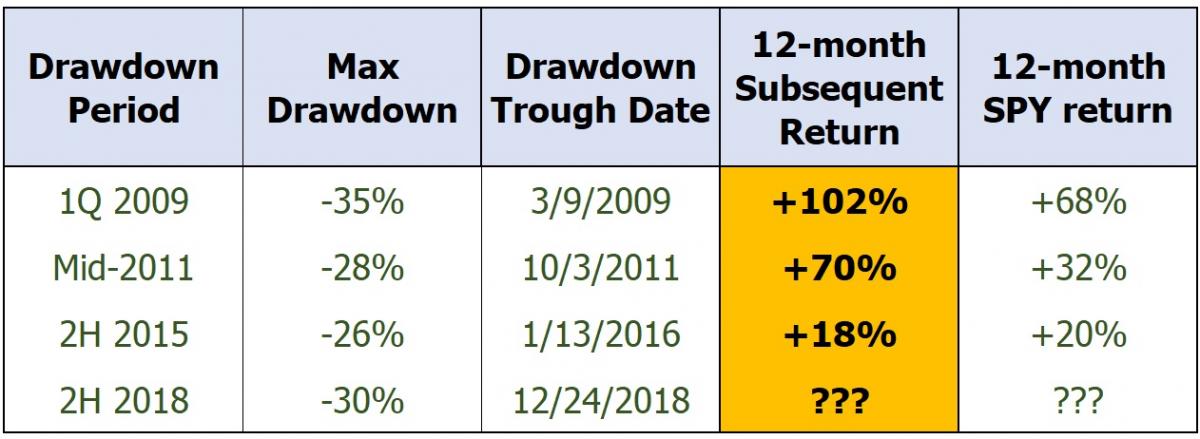
As a reminder, ever since Sabrient published our first Baker’s Dozen top picks list 10 years ago, a theoretical rolling model portfolio rebalanced annually experienced four major drawdowns – in 1Q2009, mid-2011, 2H2015, and 2H2018 (the current one). In each of the first three instances, markets fell despite strong or improving fundamental outlook due to news headlines or macro uncertainties. But in retrospect, selling at each of those previous instances would have been the wrong thing to do. The table below shows the 12-month forward performance of the January Baker’s Dozen rolling model portfolio after each of the previous drawdowns (of more than 25%). Of course, past performance is no guarantee of future results, and we don’t know how the 12-month performance will turn out after this latest drawdown, but as I mentioned earlier, the average return of the 12 monthly portfolios launched in 2018 from the low on Christmas Eve through the end of January was +19.7%, versus +15.2% for the SPY.
(Click on image to enlarge)
At Sabrient, we remain confident in the timeless appeal of a growth-at-reasonable-price (GARP) approach that seeks out stocks with strong expected earnings growth and sound earnings quality that are selling at attractive forward valuations. After all, whether you are starting a business, acquiring another company, or looking for a sound investment, such GARP qualities are intuitively appealing. In spite of what you might hear from the doomsayers who manage to grab so much attention from the media, our model (which aggregates the forward estimates of the many sell-side analysts who cover the universe of US-listed companies) has consistently suggested that the economy still has legs and remains bullish on many of the cyclical market segments, as well as small and mid-caps.
Besides Sabrient’s flagship Baker’s Dozen portfolios, another option an investor might consider in the current environment is our Dividend portfolio, given that it is expected to pay a dividend yield of around 4.3% but also comprises 50 GARP stocks (e.g., Financial, Energy, Materials, Industrial sectors, plus Real Estate) – rather than the typical “bond proxy” stocks from higher-yielding defensive sectors (e.g., Utilities and Staples) that you often see in a dividend-focused portfolio. So, I would categorize it as a growth-and-income strategy. We also publish other GARP portfolios focused on Small Cap Growth, Defensive Equity, and Rising Rate (i.e., stocks that tend to thrive in a rising interest rate environment).
SPY Chart Review:
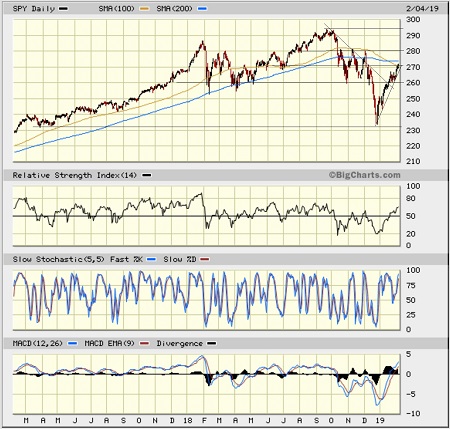
The SPDR S&P 500 ETF (SPY) closed Monday (Feb 4) just below 272. After a “capitulation” day on Christmas Eve, it has been on a relentless upward spike to recapture where it started in 2018. My last article in early January observed that price had come a long way in a short time, recapturing the 20-day SMA and now challenging the 50-day SMA near 263, and would likely soon need to pause for a breather so that the oscillators could cycle back down. There was also a symmetrical triangle formation. Instead of pulling back, price was able to consolidate in place for several days to work off some of the overbought conditions before heading higher. Although overbought conditions have returned, the intermediate-term technical picture remains promising. Oscillators RSI, Slow Stochastic, and MACD are all right back to the extremely overbought territory, and I still think we are due to cycle back down in the near term, which should bring price down a bit and allow the bulls to gather new troops and renew conviction before marching higher to challenge overhead resistance levels. I am showing the 2-year chart this time because I want to illustrate that the 100-day simple moving average (SMA) provided reliable support throughout 2017 and to an extent in 2018, while backed up by the 200-day SMA, but once the Q4 selloff kicked in, the 100-day became reliable resistance. Now we see price challenging the 100-day resistance around 270, with the 200-day just above near 274. I think we will see something of a pullback before a confirmed breakout above the 200-day SMA.
(Click on image to enlarge)
Latest Sector Rankings:
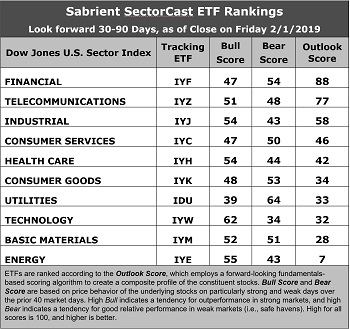
Relative sector rankings are based on our proprietary SectorCast model, which builds a composite profile of each of over 600 equity ETFs based on bottom-up aggregate scoring of the constituent stocks. The Outlook Score employs a forward-looking, fundamentals-based multifactor algorithm considering forward valuation, historical and projected earnings growth, the dynamics of Wall Street analysts’ consensus earnings estimates and recent revisions (up or down), quality and sustainability of reported earnings, and various return ratios. It helps us predict relative performance over the next 2-6 months.
In addition, SectorCast computes a Bull Score and Bear Score for each ETF based on recent price behavior of the constituent stocks on, particularly strong and weak market days. A high Bull score indicates that stocks within the ETF recently have tended toward relative outperformance when the market is strong, while a high Bear score indicates that stocks within the ETF have tended to hold up relatively well (i.e., safe havens) when the market is weak.
Outlook score is forward-looking while Bull and Bear are backward-looking. As a group, these three scores can be helpful for positioning a portfolio for a given set of anticipated market conditions. Of course, each ETF holds a unique portfolio of stocks and position weights, so the sectors represented will score differently depending upon which set of ETFs is used. We use the iShares that represent the ten major U.S. business sectors: Financial (IYF), Technology (IYW), Industrial (IYJ), Healthcare (IYH), Consumer Goods (IYK), Consumer Services (IYC), Energy (IYE), Basic Materials (IYM), Telecommunications (IYZ), and Utilities (IDU). Whereas the Select Sector SPDRs only contain stocks from the S&P 500 large-cap index, I prefer the iShares for their larger universe and broader diversity.
(Click on image to enlarge)
Here are some of my observations on this week’s scores:
1. Financial has taken the top spot with an Outlook score of 88. It displays an attractive forward P/E of 14.3x, a reasonable forward EPS growth rate of 13.2%, a forward PEG (ratio of forward P/E to forward EPS growth rate) of 1.09, the best insider sentiment (open market buying), and the best sell-side analyst sentiment (net positive revisions to EPS estimates), since most of the sectors have been seeing negative revisions. Telecom moves down to the second spot with an Outlook score of 77, and it displays the lowest forward P/E of 13.2x and strong return ratios. However, it has absorbed some significant reductions to earnings estimates and its pure GARP metrics are only average, with projected year-over-year EPS growth rate of only 7.5% and a forward PEG ratio of 1.77, which ranks it only 8th out of 10 sectors on PEG (this is why we don’t see many Telecoms as candidates for Sabrient’s GARP portfolios, which have a 12-24 month outlook rather than 3-6 months). Industrial has moved into third with reasonably solid scores across the board. Consumer Goods (Discretionary/Cyclical) and Healthcare round out the top five.
2. At the bottom of the rankings, we again find Energy and Basic Materials. Energy continues to get hit with downward earnings revisions for 2019 (although 2020 looks much better), it has the highest forward P/E of 18.7x (least attractive), and its return ratios are weak, although it also displays the strongest projected EPS growth rate of 41% and the lowest forward PEG of 0.45. Materials has fallen from #2 last month, as it has been hit with negative EPS revisions recently, although it displays a reasonable forward P/E of 14.9x.
3. Looking at the Bull scores, Technology enjoys the top score of 62, followed by Energy at 55, as stocks within these sectors have displayed relative strength on strong market days. Defensive sector Utilities scores the lowest at 39. The top-bottom spread is 23 points, which reflects low sector correlations on strong market days. It is desirable in a healthy market to see low correlations reflected in a top-bottom spread of at least 20 points, which indicates that investors have clear preferences in the market segments and stocks they want to hold (rather than broad risk-on behavior).
4. Looking at the Bear scores, as usual, we find defensive sector Utilities alone in the top spot with a score of 64, which means that stocks within this defensive sector have been the preferred safe havens lately on weak market days. Technology has by far the lowest score of 34, as investors have fled during recent market weakness. The top-bottom spread is 30 points, which reflects quite low sector correlations on weak market days. Ideally, certain sectors will hold up relatively well while others are selling off (rather than broad risk-off behavior), so it is desirable in a healthy market to see low correlations reflected in a top-bottom spread of at least 20 points.
5. Financial displays the best all-around combination of Outlook/Bull/Bear scores, followed by Telecom, while Energy is the worst. Looking at just the Bull/Bear combination, Utilities and Materials are tied for the best, although Materials has the better balance between the Bull and Bear scores, indicating superior relative performance (on average) in extreme market conditions (whether bullish or bearish), while Technology scores the worst.
6. This week’s fundamentals-based Outlook rankings still reflect a slightly bullish bias, given that three of the top five sectors are economically-sensitive or cyclical, and one (Healthcare) is all-weather. Keep in mind, the Outlook Rank does not include timing, momentum, or relative strength factors, but rather reflects the consensus fundamental expectations at a given point in time for individual stocks, aggregated by sector.
ETF Trading Ideas:
Our Sector Rotation model, which appropriately weights Outlook, Bull, and Bear scores in accordance with the overall market’s prevailing trend (bullish, neutral, or defensive), now displays a neutral bias and suggests holding Financial (IYF), Telecom (IYZ), and Industrials (IYJ), in that order. (Note: In this model, we consider the bias to be neutral from a rules-based trend-following standpoint when SPY falls between its 50-day and 200-day simple moving averages.)
Besides iShares’ IYF, IYZ, and IYJ, other highly-ranked ETFs in our SectorCast model (which scores nearly 500 US-listed equity ETFs) from the Financial, Telecom, and Industrial sectors include First Trust NASDAQ Bank (FTXO), iShares Global Communication Services (IXP), and US Global Jets (JETS).
If you prefer a bullish bias, the Sector Rotation model suggests holding Technology, Telecom, and Industrial, in that order. On the other hand, if you are more comfortable with a defensive stance on the market, the model suggests holding Financial, Utilities, and Telecom, in that order.
An assortment of other interesting ETFs that are scoring well in our latest rankings include iShares US Financial Services (IYG), Global X SuperDividend REIT (SRET), iShares Latin America 40 (ILF), iShares US Broker-Dealers & Securities Exchanges (IAI), Oppenheimer S&P Financials Revenue (RWW), SPDR S&P Transportation (XTN), WBI BullBear Value 1000 (WBIF), SPDR S&P 500 Buyback (SPYB, Janus Henderson Small Cap Growth Alpha (JSML), and VanEck Vectors High Income Infrastructure MLP (YMLI).
Disclosure: The author has no positions in stocks or ETFs mentioned.
Disclaimer: This newsletter is published solely for informational purposes and is not to be construed as advice or a ...
more


A cheery tariff optimism. The flaw is regarding the lifting of current tariffs. Trump has hinted he may not do so. Further, he is not going to lift steel tariffs. Forced technology transfers are not illegal. China may pass a law that may be lightly enforced making them illegal. That is hardly the biggest deal ever. We have American companies wanting access to China while they also want protection from China's superior and yet cheaper products. This is crazy.