
Record-Breaking Increase In GDP
The Bureau of Economic Analysis announced today that seasonally adjusted U.S. real GDP grew at a 33.1% annual rate in the third quarter. That’s the largest change ever recorded, even bigger than the -31.4% annual rate now reported for 2020:Q2. What do those numbers tell us?
The first thing to note is that “annual rate” refers to what the growth rate would be if growth were to continue for a full year at the pace observed in the third quarter. It’s often helpful to think in terms of those units. But in this case, there is zero possibility that growth will continue at this pace. Real GDP in Q3 was actually 1.074 times as big as real GDP in Q2. The calculation 1.0744 = 1.331 is where the reported 33.1% number comes from.
The second thing to note is that even if real GDP had fallen by 31% in Q2 and grown by 33% in Q3 (which they didn’t), that wouldn’t leave us ahead of where we started. Because real GDP was so much lower in Q2 than in Q1, 31% of Q1 GDP (the base used to calculate a growth rate in Q2) is a much bigger number than 33% of Q2 GDP (the base used to calculate a growth rate in Q3). A 30% drop followed by a 30% gain would actually leave us down on net by 9% (0.7 x 1.3 = 0.91). This is one of many reasons why many economists prefer to use logarithms rather than percent changes. The change in the log of real GDP in Q2 was -0.094 and the change in Q3 was 0.071. Adding those two changes together gives -0.023, which is the correct summary of the situation: real GDP was about 2.3% lower in Q3 than it had been in Q1.
To quote log changes at an annual rate, we could multiply the quarterly change in the logarithm by 4 if we thought the situation might continue for a full year. Another way to report the data at an annual rate is to use the year-over-year change in the log, as in the graph below.
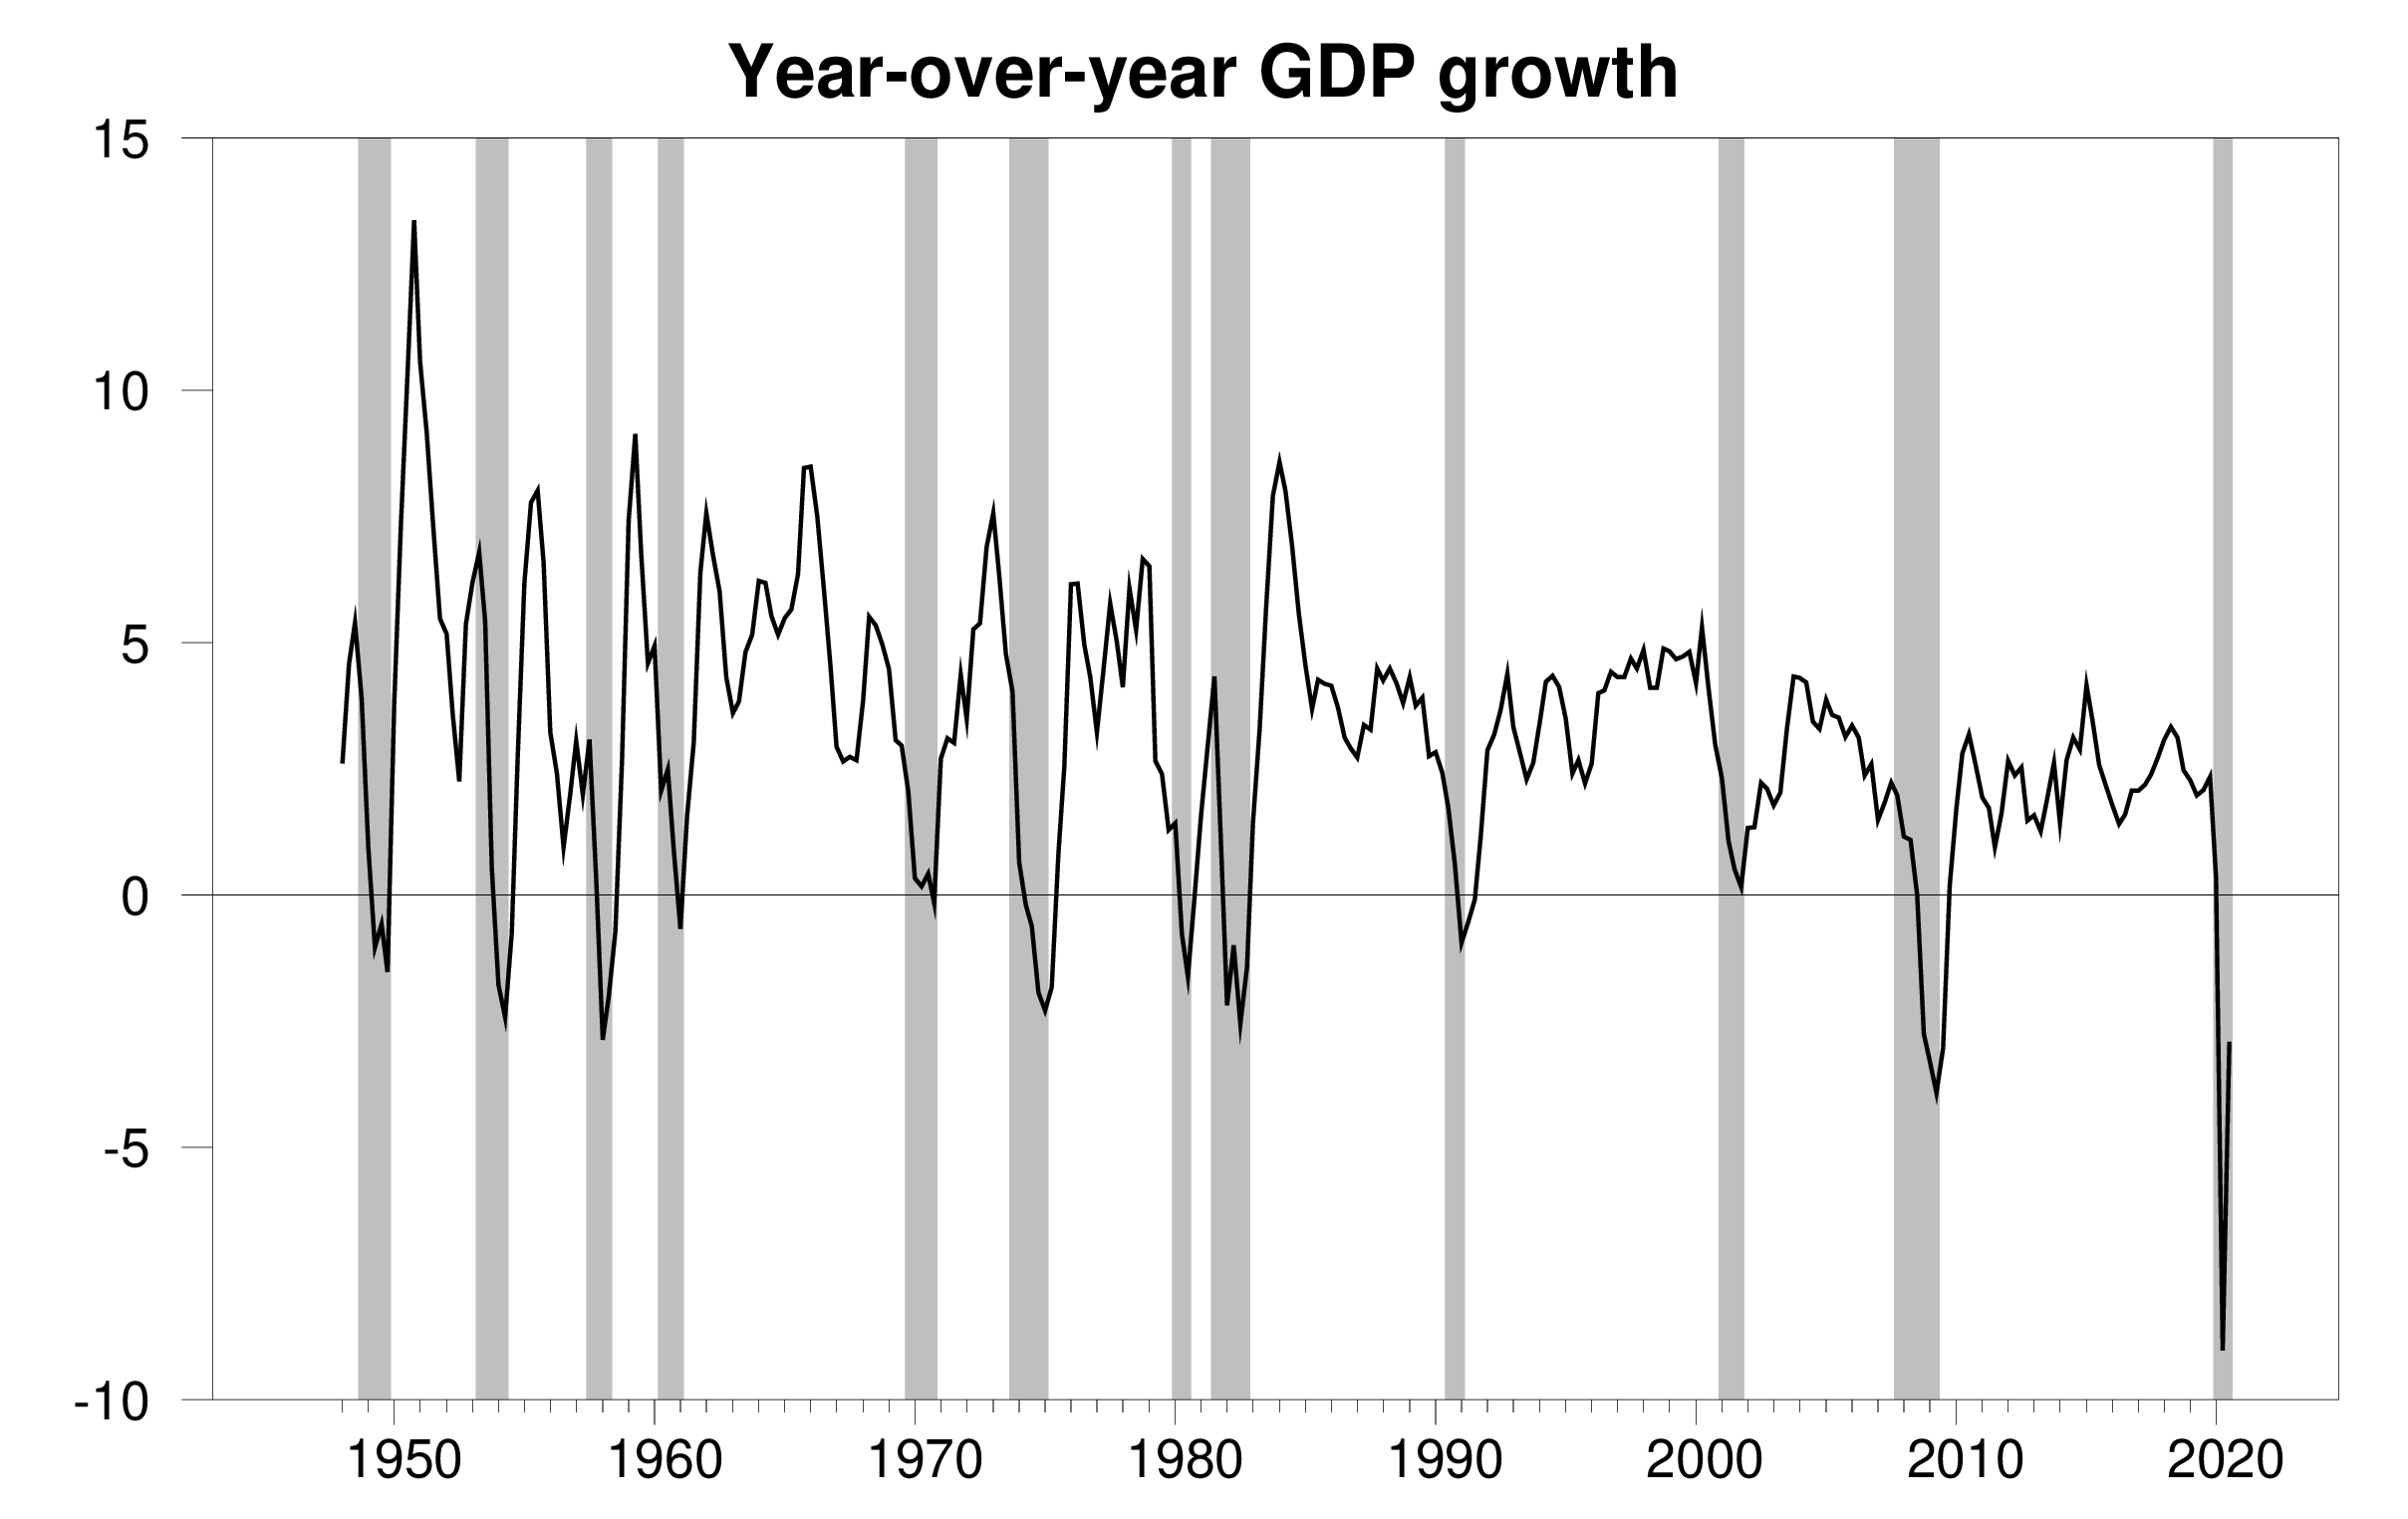
100 times the difference between the natural log of real GDP in quarter t and the value in quarter t-4. Raw data from FRED.
None of this should distract us from acknowledging just how remarkable both the Q2 and Q3 numbers are. One measure of how unusual they are is based on the standard deviation of quarterly changes in the log of real GDP over 1947:Q2 to 2019:Q4. An observation that is 5 standard deviations from the historical average, or a 5-sigma event, is sometimes called a “black swan” — something that is not at all expected until you see one. The fall in real GDP in Q2 was an 11-sigma event, and the increase in Q3 was a 7-sigma event. Both extremely remarkable. But combined they leave us 4 sigmas short of where we were in Q1, which itself was already down from normal.
These numbers bring the Econbrowser recession indicator index up to 100.0% for Q2. As we’ve done every quarter for the last 15 years, we wait for one quarter of data revisions and updates before calculating the value for the previous quarter. Thus the number posted today (100.0%) is an assessment of the situation of the economy in 2020:Q2. The index had already been up to 97.1 for 2020:Q1. There is no question that we should count 2020:Q1 and Q2 as part of the 12th postwar U.S. recession. We will wait until the Q4 GDP data release before calculating a value for Q3, though it’s quite clear now that unless the numbers get drastically revised, the recession could now be said to be over and we’ve begun the recovery phase.

GDP-based recession indicator index. The plotted value for each date is based solely on the GDP numbers that were publicly available as of one quarter after the indicated date, with 2020:Q2 the last date shown on the graph. Shaded regions represent the NBER’s dates for recessions, which dates were not used in any way in constructing the index.
The convention of designating a 5-sigma event as a “black swan” is based in part on the assumption that the data could be characterized as coming from a Normal distribution. For a Normally distributed random variable, getting an observation 5 standard deviations away from the mean is truly extraordinary. But it’s abundantly clear that GDP growth is not Normally distributed. Indeed, the statistical framework underlying our recession indicator index is the idea that GDP growth comes from a mixture of Normal distributions corresponding to different phases of the business cycle. To adequately characterize the Q2 and Q3 observations, we’d probably want to add a third distribution that could describe these two observations alone. Michele Lenza and Giorgio Primiceri have a new research paper in which they discuss statistical strategies like this for dealing with the extreme observations that are coming in for 2020. For purposes of constructing a continuing index, I have kept the parameters of the model fixed at the values estimated over 1947:Q1 to 2020:Q1, treating the COVID recession as in the same category as other historical recessions.
The COVID recession is a remarkable outlier not just in terms of the magnitude of the change in real GDP but also in terms of its composition. In all previous historical recessions, consumer spending on services was quite stable during the downturn. This time consumer services have been the biggest part of the story.

100 times the difference between the natural log of real consumer purchases of services in quarter t and the value in quarter t-4. Raw data constructed from FRED
By contrast, purchases of consumer durables usually take a bit hit in a recession. The decrease in Q2 was pretty minor, and Q3 saw a big boom that now puts durables way up relative to the start of the year. Money saved from restaurants and travel is showing up in spending on big-ticket items.
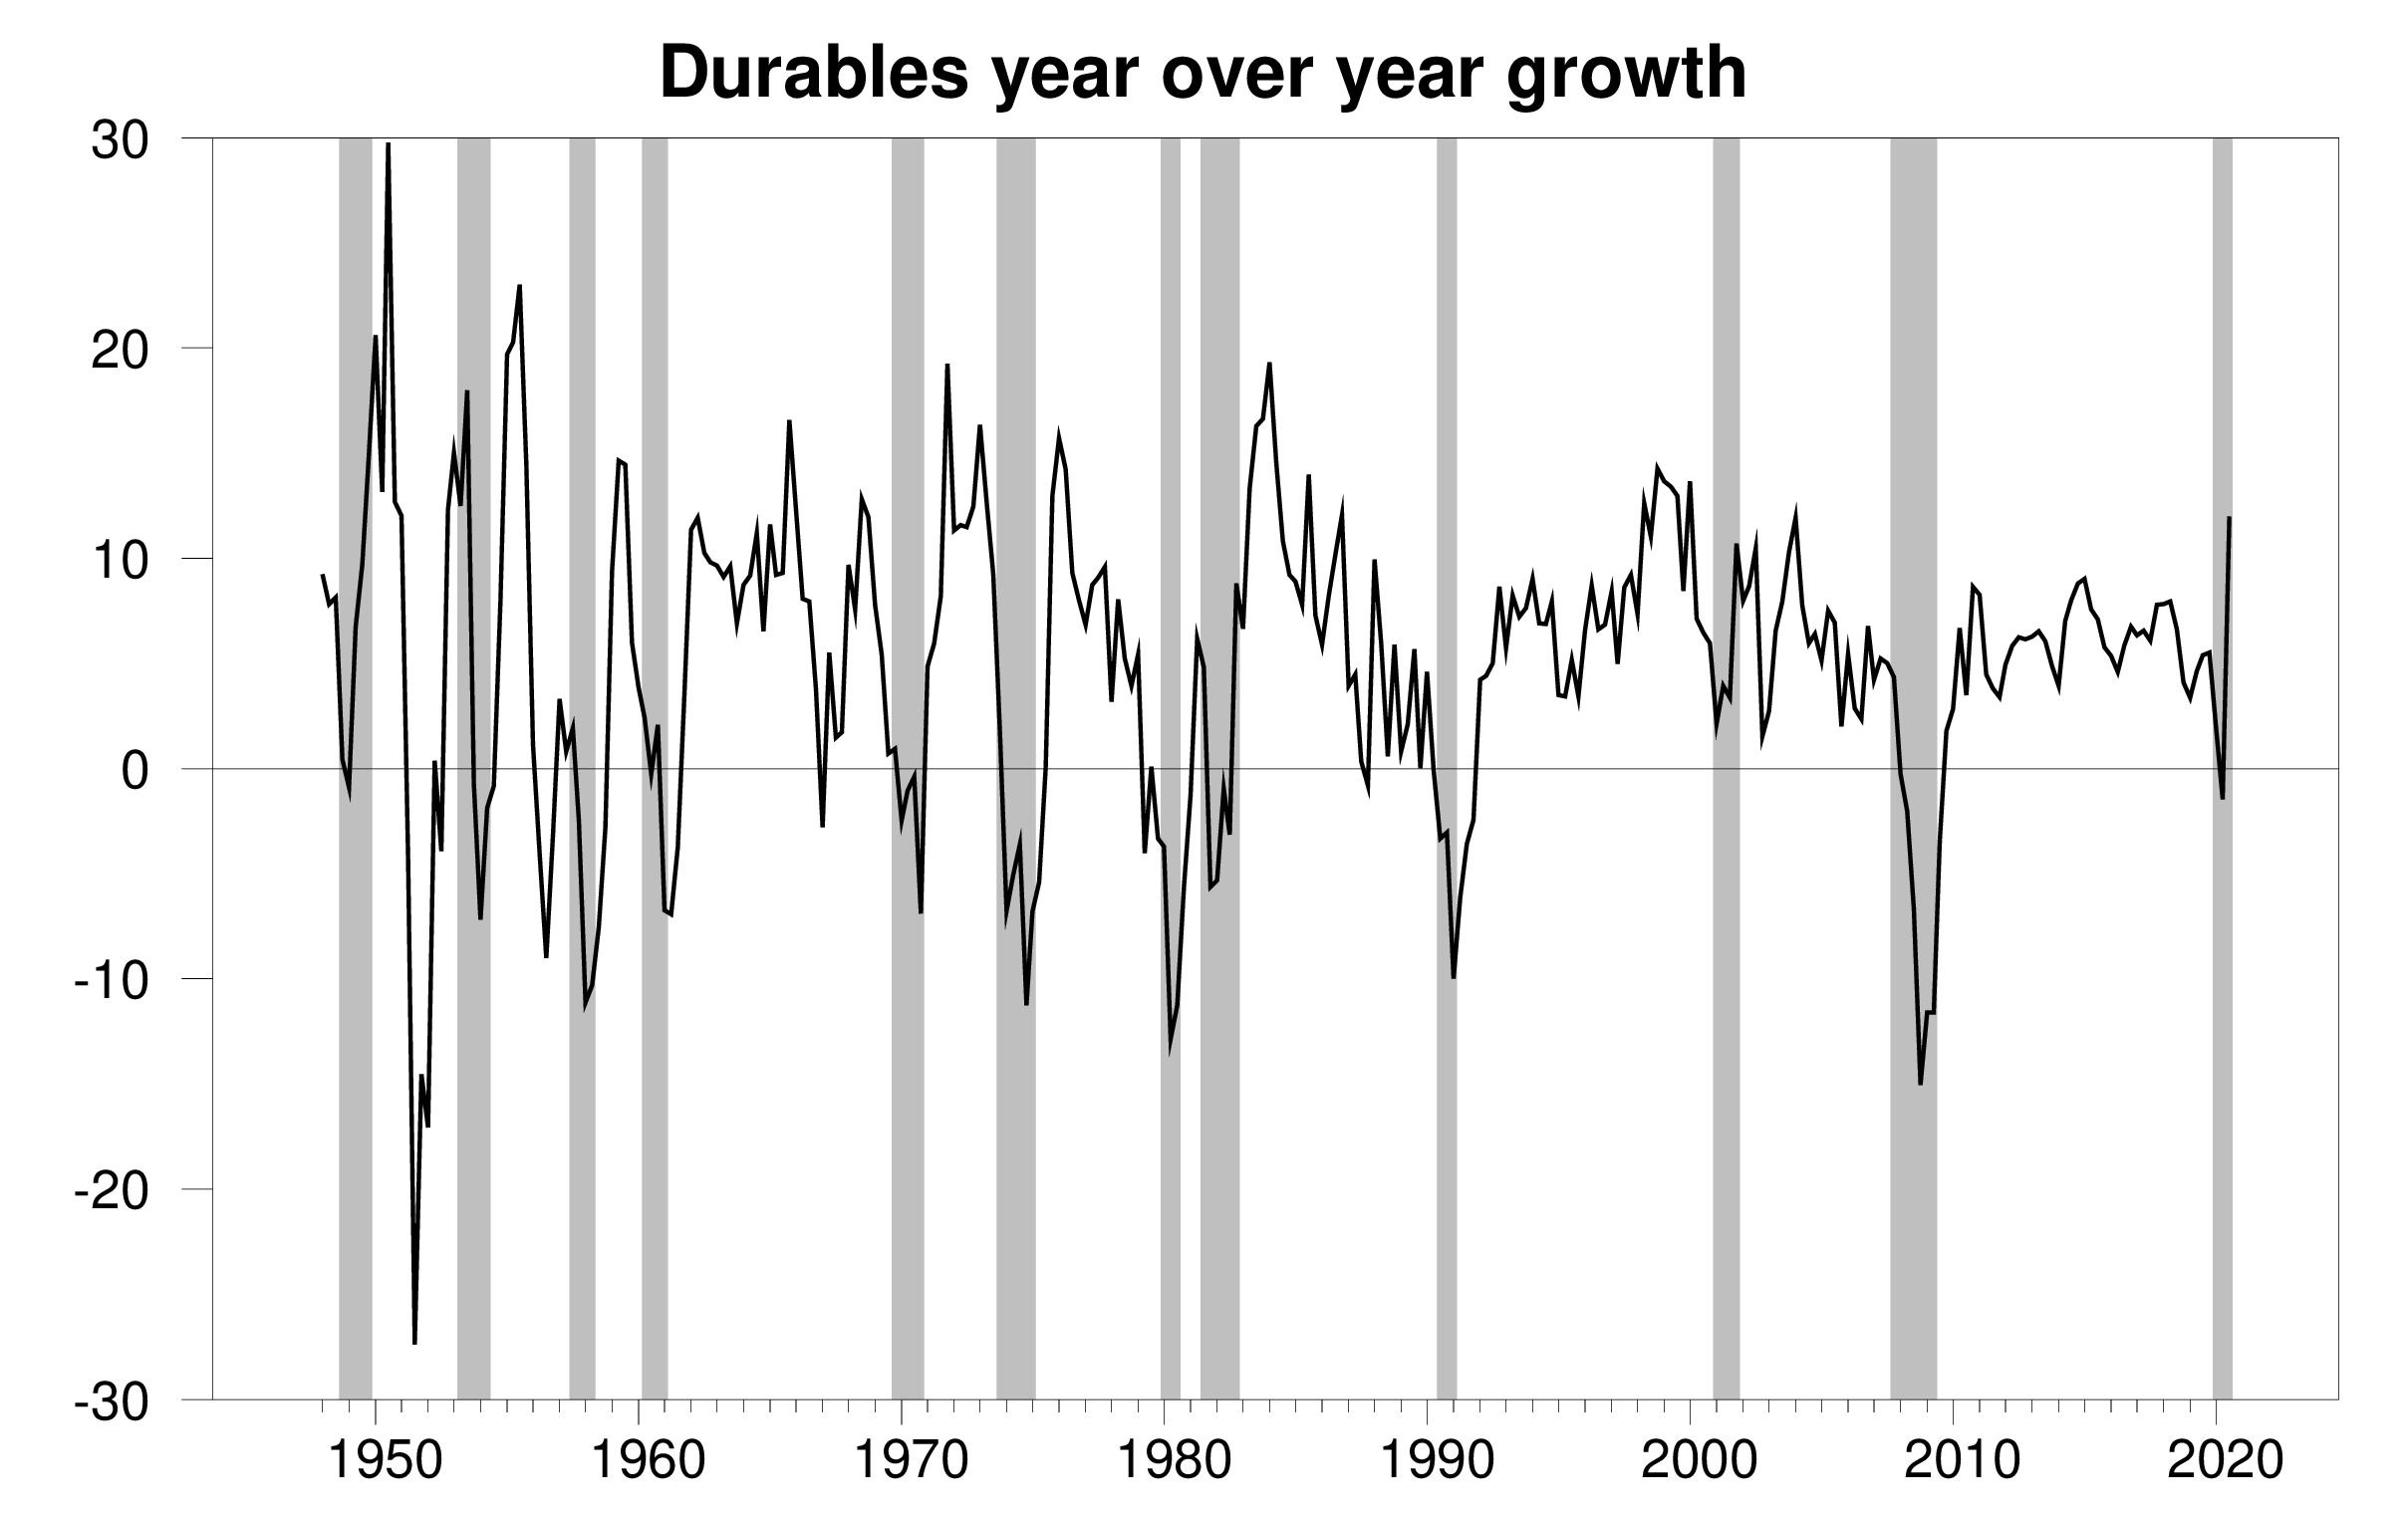
100 times the difference between the natural log of real consumer purchases of durables in quarter t and the value in quarter t-4. Raw data constructed from FRED
Investment spending is usually the big story in recessions. As of Q3, investment is still down on net, but by much less than we see in a typical recession.
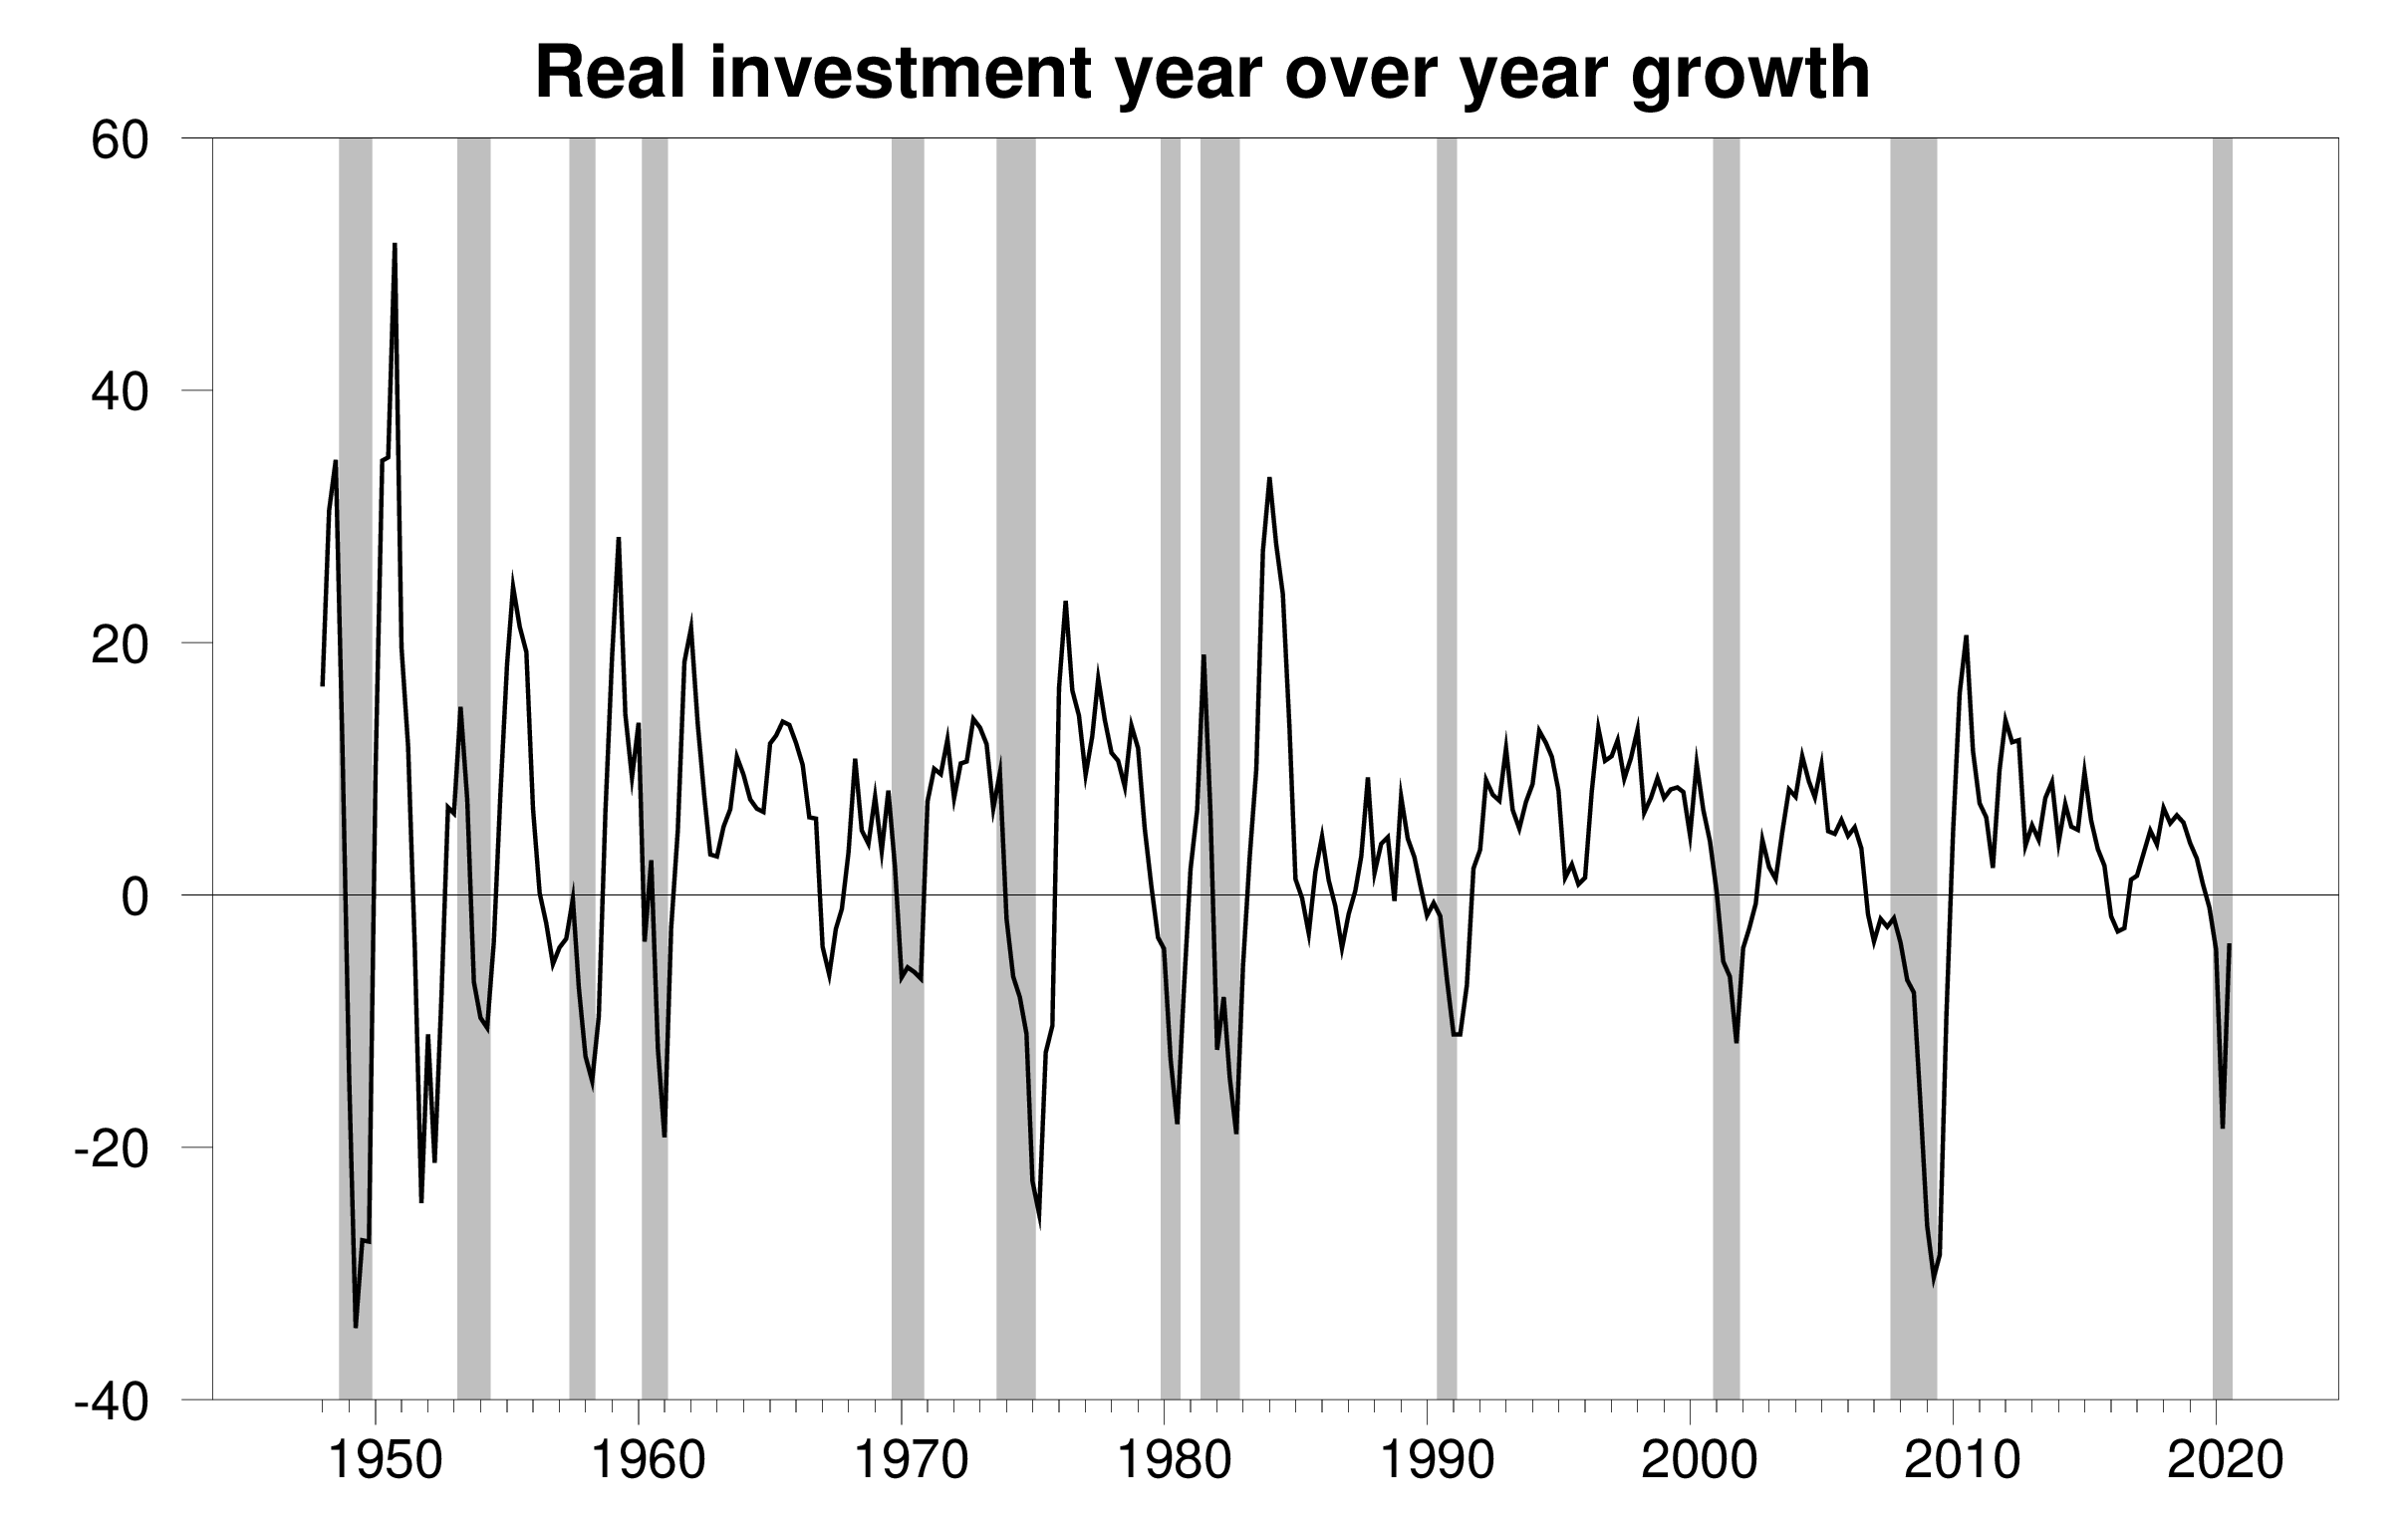
100 times the difference between the natural log of real investment spending in quarter t and the value in quarter t-4. Raw data from FRED
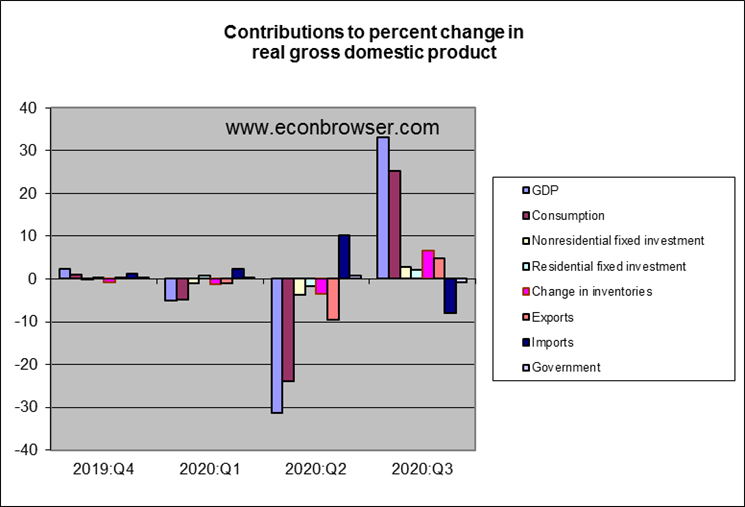
Here’s how the various broad components contributed to the annualized percentage growth rate each of the last 4 quarters:
So where does that leave us? Both the recession and the recovery now underway are very, very different from anything the U.S. has experienced historically. Traditional business cycle dynamics arising from durable and investment spending have so far not been a factor. Coping with the pandemic itself should be the top priority.
Disclosure: None.


