
Rates Are In The Driver’s Seat
THE THIRD QUARTER WAS JUST A PRELUDE TO OCTOBER
The third quarter was relatively benign for financial assets as volatility remained subdued, equity markets grinded towards new all-time highs and interest rates steadily tracked higher. Strength in the dollar revealed cracks in emerging market equities and bonds, but for the most part, the Summer doldrums lived up to their name despite media concerns surrounding tariffs, peak-profits, mid-term elections, and whatever other headline became the flavor of the day. We have been adamant that investors ignore the geo-political risks that litter the front page and focus on interest rates, as they pose the largest risk to financial assets - both “risky” and “safe.” Not only are they the discount factor from which all financial assets are priced, but they are the one valuation metric (earnings yield differentials) that has kept adept investors exposed to equity markets throughout this bull market. CAPE ratios, among others, cannot make this claim. And barring a collapse in company earnings, earnings differentials are still attractive, historically.
Still, it is no coincidence that as Treasury yields jumped to new highs in October, the stock market lost some of its steam. Like the correction earlier in the year, a rate spike provided a catalyst for risk assets to sell-off. And I expect, like earlier this year, it will take some time for markets to consolidate and eventually move higher until the next rate spike. In this manner, there will continue to be periods of elevated volatility and fear, followed by steady advances and complacency. But the consistent theme will be higher rates.
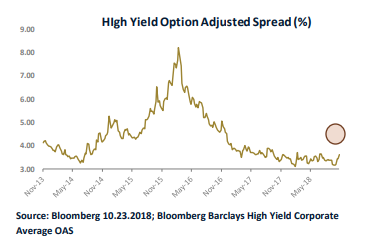
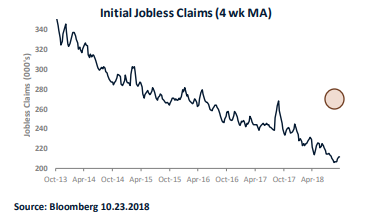
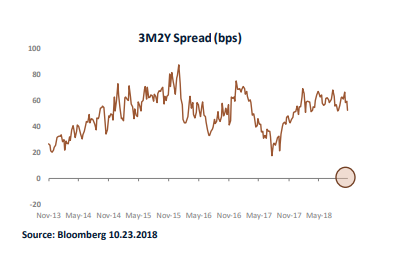
We continue to monitor the macro-data as it is released and are concentrating on three indicators closely: initial jobless claims, high yield spreads, and the spread between the two-year Treasury yield and the 3-month T-Bill yield. The three signals that we believe will indicate an end to the bull market are the following:
1) High yield spreads breach 400 bps
2) The 4-week moving average of initial jobless claims jumps at least 50k
3) The 2Y-3M spread becomes inverted
As you can see below, as of the writing of this newsletter, none of these indicators are flashing red. As such, it is still a buy-the-dip market, and we will treat it as such. (charts) I suspect that by the time these indicators turn, S&P 500 earnings yield differentials will not be as attractive as they are currently.
SECULAR & CYCLICAL FORCES ARE WEIGHING ON TREASURIES
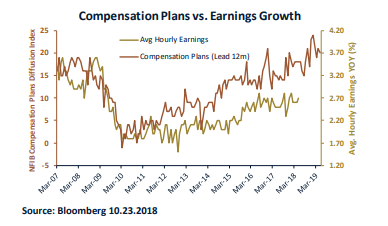
In our last newsletter, “The United States is becoming more normal”, I laid out the secular and demographic argument as to why the waning labor supply glut is likely to be inflationary. Here, I will concentrate more on the short-term cyclical reasons for higher rates. First, compensation plans, as measured by the NFIB Small Business Survey continue to be robust, and this data series typically leads earnings growth by about twelve months. Earnings growth has been a crucial missing link to this recovery, but its coming. And with it – demand for goods and services.
Second, real GDP in the U.S. is higher than potential GDP for the first time since 2005. Typically, when the excess capacity of an economy falls, prices rise as the supply of goods and services is outstripped by demand.
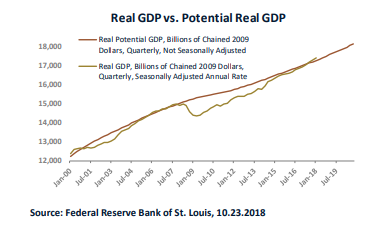
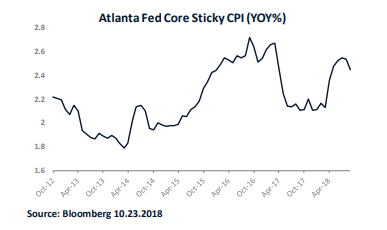
This potential imbalance alongside rising wages is a recipe for inflation and it puts the long-end of the curve, which still exhibits a negative term-premium, at risk. Core CPI and CPI are already increasing at 2.2 and 2.3 percent respectively, and other measures such as the Atlanta Fed’s core sticky price index are increasing at 2.5% year-over-year.
One of the arguments treasury bulls and equity bears espouse is that debt levels in the U.S. economy will ultimately prove deflationary – as the economy diverts more resources to debt service and repayment, consumption will falter. Absolute debt levels may sound onerous, but a differentiation between private and public sector debt should be noted. Consumer and corporate debt can ultimately be a hindrance to consumption. However, public sector debt is NOT constrained by a balance sheet, and fiscal irresponsibility is ultimately punished by markets through the devaluation of the dollar and higher interest rates. Unless the federal government pursues a fiscal austerity program, government spending will not be a drag on the economy. We expect that the U.S. government will continue with its profligate spending and that austerity will not soon pose a risk. It is far more likely, that federal spending cuts will only be realized after market forces drive interest rates and the dollar to such burdensome levels that the government has no choice but to adopt austerity.
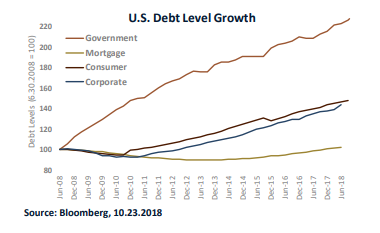
The chart below shows the growth of debt (normalized) in various sectors over the past decade. Consumer debt has grown 48%, corporate debt has grown 42%, mortgage debt has grown 2%, and federal debt has grown 128%. Over this same period, nominal GDP has grown 39%. It seems the only entity that is glaringly living outside of their means is the federal government, but again, it is not constrained by a balance sheet, only funding rates. In this context, it seems that the “onerous” debt levels that are so often quoted, may prove to be inflationary and a catalyst for higher rates.
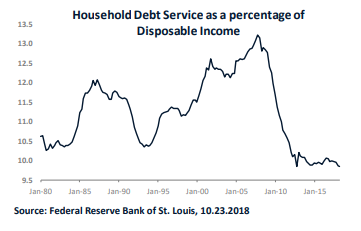
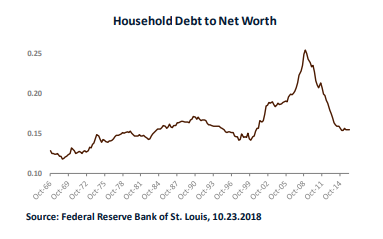
Meanwhile, the U.S. consumer is in a much healthier position. Debt service as a percentage of disposable income is at its lowest level since 1980. The difference between now and the last two major recessions is glaring. Additionally, consumer debt to net worth is below its 50-year average. The underlying health of the consumer is a boon to demand, and a deflationary environment stemming from a lack of demand is unlikely.
MONEY SUPPLY & VELOCITY
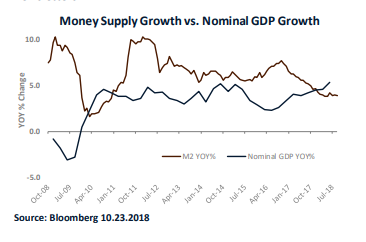
M2, the broadly accepted measure of the money supply available to an economy, is an indicator of potential inflation. It is the dry powder, so-to-speak, in an economy that can eventually be used for consumption or investment. When M2 is growing rapidly, especially relative to nominal GDP, it indicates fear as investors and corporations hold more cash relative to their income. This indicates that less money is chasing goods/services, and deflationary. The opposite is also true. When M2 is growing more slowly than nominal GDP, investors and corporations are willing to hold less cash relative to their incomes, and more money is chasing goods/services. As you can see in the chart below, 2018 marked the first time in eight years that nominal GDP growth exceeded money supply growth. The risk-aversion that has plagued this economic recovery may finally be waning. It is the Fed’s job to adjust policy to counteract the declining demand for money or they will risk higher inflation. We expect the current rate-hike program to persist for longer than the market expects, as we have noted in prior newsletters.
LARGE FUNDS GRAVITATE TOWARDS LIQUIDITY AND THOSE MARKETS ARE INTEREST RATE SENSITIVE
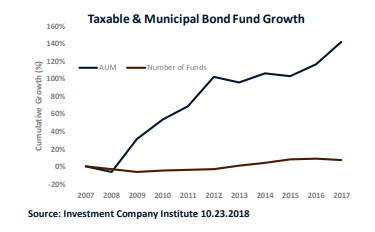
Over the past ten years, there have been significant inflows into fixed-income mutual funds, both taxable and municipal. At the end of 2017, there was over $4 Trillion in fixed-income mutual funds representing cumulative growth of 142% over the last decade. Meanwhile, the number of funds has only grown 7% over the same period. The implication is that existing funds have grown rapidly in terms of their AUM.
Size is an important determinant in what underlying securities these funds invest in as they need a certain amount of liquidity to fund potential redemptions etc. Below is a chart showing the amount of outstanding bonds in a variety of domestic fixed-income sectors.
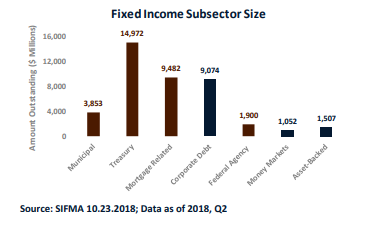
Naturally, larger funds are forced to gravitate to the more liquid subsectors, which happen to be those that are most sensitive to rate fluctuation (in red). Municipals, treasuries, agency pass-throughs, and agency bonds account for approximately 72% of the fixed income market. Exposure to rate sensitive bonds is great when interest rates are falling but they tend to underperform when rates are rising.
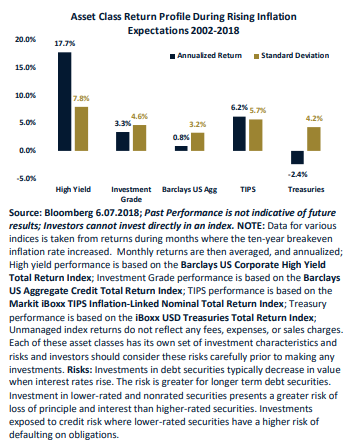
Our research indicates that in rising inflationary/rate environments, corporate bonds and TIPS tend to outperform Treasuries and other more rate sensitive subsectors. However, corporate bonds represent only 22% of the investable universe of bonds, and TIPS represent approximately 3%. As a result, it is much more difficult for larger funds to outperform when interest rates are rising since they inherently gravitate to more interest rate sensitive sectors.
For those larger funds that do access the corporate credit market, liquidity can still be an issue. Consider a hypothetical fund managing $40 Billion. A 1% position in that fund is $400 Million. The average issue size of the corporate bonds that have traded over the last thirty days is $810 Million. That fund would have to accumulate half of the float of the average bond to build a meaningful position. Unloading such a position would be difficult since the average trading volume over the last 30 days (for those bonds that have traded) amounts to only 4.5% of their float. Kudos to a fund of that size that can accumulate such a position, but I expect they will be holding until maturity because it would prove incredibly difficult trading out of that type of size.
CONCLUSION
The secular and cyclical arguments for higher rates are compelling. It has been decades since the United States experienced a bear market in fixed income. And given the longevity of this run, it makes sense that there have been substantial inflows into the sector. However, all bull markets must come to an end at some point and given the concentration in rate-sensitive sectors, the extended duration of benchmarks, and the sheer size of many of the pooled assets vehicles available, the bear market may be painful for many investors.
Disclosure: This article is distributed for informational purposes only and should not be considered investment advice or a recommendation of any particular security, strategy or investment product. ...
more

