
Rankings Remain Bullish On A Promising Q1 Earnings Season
Given all the geopolitical drama and worrisome news headlines – ranging from tensions with Russia and North Korea to “Brexit 2.0” and “Frexit” to uncertainties of Trump’s fiscal stimulus to the looming debt ceiling – it’s no wonder stocks have stalled for the past several weeks. Especially troubling is the notable underperformance since March 1 in small caps and transports. Nevertheless, economic fundamentals both globally and domestically are still solid. Global growth appears to be on a positive trend that could persist for the next couple of years, and Q1 earnings season should reflect impressive year-over-year corporate earnings growth, although not without its disappointments – as we already have seen in bellwethers like Goldman Sachs (GS), Johnson & Johnson (JNJ), and International Business Machines (IBM).
I continue to like the prospects for US equities for the balance of the year. I expect breadth will be solid, correlations will stay low, and dispersion high such that risk assets continue to look attractive, including high-quality dividend payers and growth stocks, particularly small caps, which I think will ultimately outperform this year despite their recent weakness. All of this bodes well for stock-pickers.
In this periodic update, I give my view of the current market environment, offer a technical analysis of the S&P 500 chart, review Sabrient’s weekly fundamentals-based SectorCast rankings of the ten U.S. business sectors, and then offer up some actionable ETF trading ideas. Overall, our sector rankings still look bullish, although the sector rotation model has, at least temporarily, moved to a neutral stance as the short-term technical picture has become cloudy. But after the pro-EU election results in France on Sunday, stocks may be ready for an upside breakout, no matter what Trump accomplishes in this final week of his first 100 days on the job. Read on....
Market overview:
The market has been going through a bit of a defensive rotation since March 1. I must admit that it is dispiriting to see how the initial exuberance following the presidential election has subsided, at least until President Trump demonstrates he can deliver his widely-anticipated fiscal stimulus, including healthcare, tax, and regulatory reform, plus some sort of infrastructure spending package. Oh, and by the way, we are rapidly coming up on the debt ceiling and a government shutdown, so we need to pass a federal budget, to boot. All in a day’s work, right? So yes, I expect stocks will see increased volatility from time to time when the circumstances cause correlations to rise in a risk-on/risk-off fashion, especially in response to any news regarding Trump’s policies or global saber-rattling.
After the SPDR S&P 600 Small Cap ETF (SLY) peaked on December 9 (with an 18% post-election gain), it has since fallen about -4.2%, while the SPDR S&P 400 Mid Cap ETF (MDY) is up a modest +1.2% and the SPDR S&P 500 Large Cap ETF (SPY) is up a respectable +3.6%. Nevertheless, passage of any semblance of Trump’s stimulus plans should be especially beneficial to small caps.
It is notable that the initial “Trump Bump” favored Financial and Materials sectors, but more recently both have slumped while Technology and Healthcare have become two of the best-performing sectors. Year-to-date, the Technology sector is the leader, up about +12%, followed by Healthcare, Consumer Staples, Consumer Discretionary, and Utilities, while Industrial and Materials have been flat, and Financial, Telecom, and Energy have been laggards. This further illustrates to me that while investors are generally cautious at the moment, they still see Tech names as being uniquely poised to thrive as providers of devices, parts, and services to all other sectors and consumers, and to both domestic and international customers, provided that there is at least some global growth. And it’s worth pointing out that a strong Tech sector historically bodes well for the U.S. economy and the stock market.
Meanwhile, homebuilders are in their own little world, continuing without worry on a steady upward march as demand for homes increases, perhaps in response to the strengthening economy, rising wages, and fears that mortgage rates are going to rise. Home starts and existing home sales (10-year high!) outperformed again in the latest data. iShares US Home Construction ETF (ITB) has gone straight up this year even as the broad indexes began to falter after March 1. It is up +3.1% since March 1 and +17% YTD. But there’s another Consumer sector segment that still can’t catch a break, and that of course is retail. Indeed, the “Amazon effect” is the widely-accepted bogeyman. But the situation for brick and mortar stores is even worse than it seems for retailers when you consider that Amazon.com Inc (AMZN) is up +20% this year, so its 30% weighting in the S&P 500 retail index has lifted the index by 8.5% despite the struggles of so many other retailers. Nevertheless, it’s worth noting that although the SPDR S&P Retail ETF (XRT) is down -2.7% YTD, it actually broke out to the upside late last week (without help from AMZN, which was flat) and might have legs.
After being a big beneficiary of short-covering and easy year-over-year comps during 2016, Energy is down over -10% so far this year. (But all is not lost as oil prices are holding up pretty well going into summer driving season, while crude oil inventories declined for the second straight week, and there may be a consensus within OPEC to extend their production cuts.) Likewise, the Financial sector enjoyed the biggest post-election pop, but has languished recently, likely due to a combination of a flatter yield curve and lower commercial lending among banks than was expected after the election. In addition, transports and small caps were looking distressingly weak on April 13, but like retail they both got a nice bounce last week. It is important that both show leadership for a sustainable bullish trend to resume.
Nick Colas of ConvergEx recently wrote about the big drop in asset price correlations, especially among US equities. He considers this to be the most important trend since the election. Sector correlations dropped from the 75-90% range to below 60%, which has given a renewed opportunity for outperformance to skilled stock-pickers. Also, by getting away from highly correlated risk-on/risk-off behavior, there has been lower overall equity market volatility. However, he also pointed out that correlations have started to creep back up over the past couple of months while market leadership has narrowed. For example, Apple (AAPL) alone represents 17% of the YTD gain in the S&P 500 and 23% of the Dow’s gain, while just five companies – AAPL, Amazon.com (AMZN), Facebook (FB), Alphabet (GOOGL), and Philip Morris (PM) – represent 32% of the S&P 500’s YTD gain.
With alternating rotation from stocks to bonds and then back again over the past few weeks, the 10-year Treasury fell further to close Friday at 2.24% while the 30-year closed at 2.89%. On the short end of the yield curve, the 2-year closed at 1.25% and the 5-year at 1.76%. The spread between the 10-year and 2-year has flattened significantly to 99 bps, while the spread between the 30-year and 5-year has actually widened a bit to 113 bps. CME fed funds futures now place the odds of the next rate hike in June at 53%, 58% by July, and 72% by September (and a 24% chance of two hikes by then). By December, there is now an 81% chance of at least one more rate hike, 40% of two or more (i.e., 3 total for the year, including the March hike that already happened), and only 10% odds of three or more.
Most commentators expect the Fed to raise twice more in 2017 (i.e., 3 total for the year), which would put its overnight lending rate at a mid-point of 1.375% by year end. Nevertheless, I think it is important to point out that the Fed is not so much “tightening” monetary policy as it is “normalizing.” In effect, Janet Yellen and her collective are only being somewhat “less accommodative” by backing off a bit from extraordinary accommodation. Keep in mind, when you subtract out inflation from the nominal interest rate, the real fed funds rate is still negative. In other words, the Fed remains dovish overall, which is why Trump seems to be changing his tune regarding keeping Janet Yellen at the helm.
However, to normalize the longer end of the yield curve, the Fed brought up the idea of selling off some of its $4.5 trillion of assets instead of holding to maturity. But there are reasons why it may need to maintain a larger balance sheet than it has historically – including increased foreign demand for U.S. dollars, which the Fed estimates will lead USD circulation to grow to $2.5 trillion or more over the next decade.
An alternative argument to this thesis suggests that foreign selling of U.S. Treasuries is destined to increase, driving up yields, because returns from U.S. obligations in Europe and Japan have actually fallen when you consider the cost of currency hedging, while the yields on their own government debt have risen. However, despite the recent softening of the US dollar against other major currencies, I still believe that geopolitical risks and low inflation here at home will continue to maintain a relatively strong dollar as foreign QE pushes cash into the safety of the US on the “carry trade” to buy a stable dollar and US Treasuries. Moreover, there is an aging population of high net worth investors and rising institutional demand for yield. As a result, rising Treasury yields largely become self-limiting in that they ultimately attract a bid (2.6% on the 10-year seems to have been the magic number lately), while speculators who bet that rates would rise precipitously this year must cover their shorts as the pain worsens and the reality sets in that the near-term profitability of shorting is not all that great after all.
China came out with some really good growth numbers, including Q1 GDP of +6.9% (its best quarter in 18 months) and Q1 retail sales of +10.0%. The Markit Flash Eurozone PMI recently showed manufacturing activity growing at its fastest pace in six years. But here at home, the Atlanta Fed’s GDPNow model forecast for real GDP growth (seasonally adjusted annual rate) continues to fall, with its Q1 2017 projection coming in at only 0.5%, which compares to 1.8% on March 1 and 2.5% on February 27. The next update will be this Thursday, April 27.
Or course, geopolitical issues include worsening tensions with Syria and North Korea, and by extension their supporters in Russia and China. Wild cards include how China deals with its massive debt, Brexit 2.0 (the next 2 years of negotiating new terms outside the EU), and elections outcomes in Italy and France (although after Sunday’s French election, it appears pro-EU centrist Emmanuel Macron is well-poised to win the May 7 runoff against Le Pen, which sent the Euro soaring). And then of course we have the Republican infighting among the various factions and its impact on the debt ceiling, which will begin rearing its ugly head starting this Friday April 28 when the last “continuing resolution” expires (although the government should be able to operate through “extraordinary measures” until October).
But if you look back on 2016, despite all the consternation and gnashing of teeth about the many serious issues in the news around the world and hear at home, including ISIS, Syria, Brexit, the presidential election, and Fed tightening, all that really mattered for stocks by year end were two things: China’s stimulus-driven recovery from the brink and the recovery in oil prices. So, perhaps the US economy and equities will once again cut through all the noise to find a way forward.
Looking ahead, there seems to be little threat of a recession on the horizon, investor sentiment is still modest (albeit more bullish than it was), M&A/IPO activity is far from overheated, credit spreads are narrow (i.e., no worries about defaults), and our SectorCast rankings (which reflect Wall Street’s expectations for individual companies, aggregated by sector) still favor economically-sensitive sectors.
To be sure, there has been no shortage of big-name experts expressing major worries. Mohamed El-Erian of Allianz SE believes the steady economic expansion since the financial crisis will end if we can’t “…take the reins from monetary policy makers in stimulating further growth with structural reforms.” And then Bill Gross of Janus Capital says he is “de-risking” by reducing holdings in junk bonds and shortening duration, opining that, “Equity markets are priced for too much hope, high yield bond markets for too much growth, and all asset prices elevated to artificial levels….” Moreover, Russell Investments warns, “…investor expectations have run ahead of market fundamentals in the global equity markets… [and we] maintain a call for caution as inflated expectations for global growth and U.S. fiscal policy drive markets higher, despite looming global economic headwinds.”
But plenty of prominent players remain optimistic. Jeff Saut of Raymond James suggests, “…we have transitioned…from an interest-rate secular bull market where interest rates come down and price/earnings multiples expand to an earnings-driven secular bull market.” He thinks we are in year 8 of a secular bull market that historically tends to run 14-16 years. Likewise, John Greenwood of Invesco expects, “…the current US expansion will continue for several years more.” And BlackRock believes that global G7 growth is on the rise with room for upside surprises, and, “…markets may still be underestimating the breadth of the global economic rebound.” Indeed, it appears that if Wall Street’s earnings estimates for Q2 come to fruition, the S&P could see 10% appreciation without further multiple expansion.
There is no denying that the S&P 500 multiple is stretched, selling for around 20x trailing earnings and 18x forward earnings versus a historical average closer to 16x, and with a Shiller cyclically-adjusted trailing valuation of 29x (although persistently low interest rates support higher multiples on a discounted cash flow basis). In addition, credit spreads are near multi-year lows and volatility remains historically low.
The CBOE Market Volatility Index (VIX), aka fear gauge, closed Friday at 14.63, but it has been struggling for the past two weeks to stay below the 15.0 threshold between complacency and fear. April 12 was the first time since the November presidential election that the VIX closed significantly above 15. One of the reasons for the persistently low volatility has been that “shorting vol” has become a popular and profitable pastime. Every minor spike gets heavily shorted, so the trade is crowded, which means that the short-covering exit trade could be quite painful for the equity markets as VIX spikes in panic mode.
I will reiterate that a nasty selloff could easily happen at some point this year – in fact, I fully expect it to. Every year tends to have at least one bout of panic/profit-protection/capital-preservation. But unless it results from a game-changing “Black Swan” event that sends the global economy into turmoil, I think it would ultimately be looked upon as a welcome buying opportunity.
Of course, making things even more challenging for stock-pickers is the fact that there are roughly half as many U.S. publicly-traded companies today versus 20 years ago, although admittedly most of those lost were quite small. Going (or staying) public has lost some appeal due to growth in regulatory oversight and compliance costs as well as the PE/VC push to either keep upstarts private or take public companies private. And among those that remain, many have reduced the number of outstanding shares through stock buyback programs. Nevertheless, there are still plenty of solid choices among firms sporting differing forward valuations based on future expectations. And many firms can boast a consistent history of growing dividend streams and stock buybacks. In fact, the total “returned capital” yield (dividends + buybacks) on the S&P 500 has been estimated to exceed 4%, which is quite attractive when compared to interest rates and when evaluating equity valuations on a discounted cash flow basis. However, I think both the economy and the investment community will demand greater allocations to capex for growth and expansion, which would be a boon to suppliers in the small-mid space. Passage of tax and regulatory reform and an infrastructure bill would hasten such an increase in capex, although I’m not counting on it for this year.
Overall, my view is that interest rates stay low (i.e., below 3% on the 10-year) this year and perhaps into next year, while the dollar and inflation remain in check and risk assets like equities remain appealing – especially high-quality dividend payers and small-mid caps. In other words, I think demand for both stocks and bonds in the US will persist. However, that’s not to say the major cap-weighted market indexes are going to surge on the back of further multiple expansion. Instead, I think the trend toward lower price correlations and higher performance dispersion will resume, thus keeping volatility under wraps and providing solid, fundamentals-based, earnings-driven stock-picking the opportunity to outperform.
SPY chart review:
The SPY closed Friday at 234.59 and has been in a downtrend for the past seven weeks since its March 1 high, displaying a series of lower highs. The 20-day simple moving average had been providing reliable support for four months, ever since the November election, and when it failed in late March, the 50-day kicked in as solid support. But in mid-April, just before the Good Friday holiday, support at the 50-day also failed. However, the breakdown lacked breadth and volume, so it wasn’t convincing. Then, the following Monday brought a strong rally, and price has been forming a series of higher lows ever since. On the other hand, the 20-day SMA crossing down through the 50-day was an unwelcome development, and we can see that both moving averages have essentially converged in a flat line and are providing challenging support-turned-resistance. If SPY falls further, next support levels include the minor low in March around 232, the 100-day SMA now approaching 231, prior resistance-turned-support levels at 230 and 225, and the critical 200-day SMA (approaching 223). As for oscillators like RSI, MACD, and Slow Stochastic, all three started to turn up early last week but are now in neutral positions, just like price.
Overall, the technical picture remains cloudy and suggests caution. However, I now see both a bullish ascending wedge with a breakout level at 236, as well as a neutral symmetrical triangle with an apex at 235. So, I expect the resolution will be to the upside, and fairly soon.
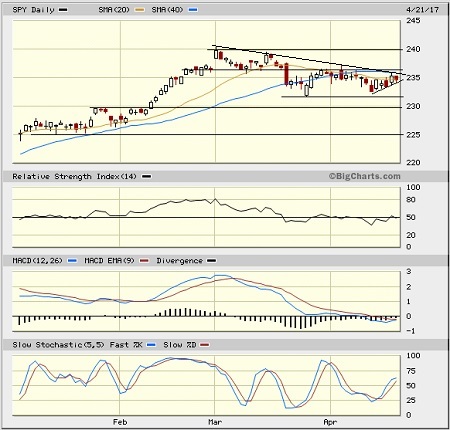
Also worth watching are the small caps, which tend to lead both breakouts and breakdowns. The Russell 2000 fell back into a sideways trading range after its March breakout of the 1400 level failed to hold. On Wednesday, while the broad market saw its rally attempt fade badly, the small caps still finished nicely positive, foreshadowing the strong and sustained broad-market rally that came on Thursday, allowing it to break out above its 20-day and 50-day SMAs. Although small caps remain stuck in the middle of a 4-month sideways trading range, this is a bullish development for the broader market.
Latest sector rankings:
Relative sector rankings are based on our proprietary SectorCast model, which builds a composite profile of each of over 600 equity ETFs based on bottom-up aggregate scoring of the constituent stocks. The Outlook Score employs a forward-looking, fundamentals-based multifactor algorithm considering forward valuation, historical and projected earnings growth, the dynamics of Wall Street analysts’ consensus earnings estimates and recent revisions (up or down), quality and sustainability of reported earnings (forensic accounting), and various return ratios. It helps us predict relative performance over the next 1-3 months.
In addition, SectorCast computes a Bull Score and Bear Score for each ETF based on recent price behavior of the constituent stocks on particularly strong and weak market days. High Bull score indicates that stocks within the ETF recently have tended toward relative outperformance when the market is strong, while a high Bear score indicates that stocks within the ETF have tended to hold up relatively well (i.e., safe havens) when the market is weak.
Outlook score is forward-looking while Bull and Bear are backward-looking. As a group, these three scores can be helpful for positioning a portfolio for a given set of anticipated market conditions. Of course, each ETF holds a unique portfolio of stocks and position weights, so the sectors represented will score differently depending upon which set of ETFs is used. We use the iShares that represent the ten major U.S. business sectors: Financial (IYF), Technology (IYW), Industrial (IYJ), Healthcare (IYH), Consumer Goods (IYK), Consumer Services (IYC), Energy (IYE), Basic Materials (IYM), Telecommunications (IYZ), and Utilities (IDU). Whereas the Select Sector SPDRs only contain stocks from the S&P 500, I prefer the iShares for their larger universe and broader diversity.
Here are some of my observations on this week’s scores:
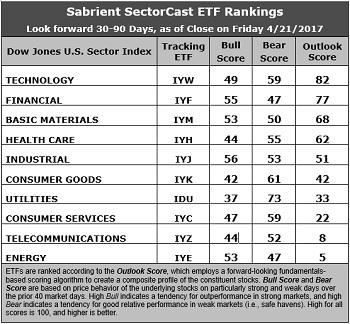
1.The rankings haven’t changed much. Technology once again retains the top spot with an Outlook score of 82. In aggregate, stocks within the sector display among the best Wall Street sell-side analyst sentiment (i.e., net positive revisions to EPS estimates), the highest return ratios, a reasonable forward P/E of about 17.6x, a strong forward long-term EPS growth rate of 13.0%/yr, and a low forward PEG of 1.35 (ratio of forward P/E to forward EPS growth rate). In second again this week is Financial with an Outlook score of 77. It has the best Wall Street sentiment, the second lowest forward P/E of 16.4x, and the best insider sentiment (net open market buying). Basic Materials has moved up to third at 68, just ahead of Healthcare at 62. Notably, Healthcare displays the lowest forward P/E of 15.9x. Rounding out the top five is Industrial, and it’s worth noting that these five sectors all have Outlook scores above 50 and net positive revisions to EPS estimates, while the bottom five all have net negative revisions.
2.Energy and Telecom remain in the bottom two with Outlook scores of 5 and 8. Telecom displays the weakest insider sentiment (net open market buying) and weak analyst sentiment (i.e., net negative earnings revisions), as well as the second highest forward P/E of 24x and the second highest (next to Utilities) forward PEG of 2.67. Energy stays at the bottom of the rankings by displaying generally mediocre factor scores across the board, including the worst return ratios and the highest forward P/E of 29x, although it also boasts the highest year-over-year forward EPS growth rate (17%) on weak comps.
3.Looking at the Bull scores, Industrial boasts the top score of 56, followed closely by Financial, as it has displayed relative strength on strong market days, while Utilities is the lowest at 37. The top-bottom spread is back up to 19 points, which reflects low sector correlations on strong market days, which is favorable for stock picking. It is desirable in a healthy market to see low correlations reflected in a top-bottom spread of at least 20 points, which indicates that investors have clear preferences in the market segments and stocks they want to hold (rather than broad risk-on behavior).
4.Looking at the Bear scores, we find Utilities at the top with a score of 73, which means that stocks within this sector have been the preferred safe havens lately on weak market days. Energy and Financial share the lowest at 47, as investors have fled during market weakness. The top-bottom spread is 26 points, which reflects low sector correlations on weak market days. Ideally, certain sectors will hold up relatively well while others are selling off (rather than broad risk-off behavior), so it is desirable in a healthy market to see low correlations reflected in a top-bottom spread of at least 20 points.
5. Technology displays the best all-around combination of Outlook/Bull/Bear scores, while Telecom is the worst. Looking at just the Bull/Bear combination, Utilities is the best (on the strength of its big Bear score), indicating superior relative performance (on average) in extreme market conditions (whether bullish or bearish), while Industrial comes in second (on more balanced scoring). Telecom again scores the worst.
6.This week’s fundamentals-based Outlook rankings look solidly bullish to me, given that the top five sectors are economically-sensitive or all-weather (Technology, Financial, Materials, Healthcare, and Industrial). Keep in mind, the Outlook Rank does not include timing, momentum, or relative strength factors, but rather reflects the consensus fundamental expectations at a given point in time for individual stocks, aggregated by sector.
ETF Trading Ideas:
Our Sector Rotation model, which appropriately weights Outlook, Bull, and Bear scores in accordance with the overall market’s prevailing trend (bullish, neutral, or defensive), displays a neutral bias and suggests holding Technology (IYW), Financial (IYF), and Basic Materials (IYM), in that order. (Note: In this model, we consider the bias to be neutral from a rules-based trend-following standpoint when SPY the fell between its 50-day and 200-day simple moving averages.)
Besides iShares’ IYW, IYF, and IYM, other highly-ranked ETFs in our SectorCast model (which scores over 600 US-listed equity ETFs) from the Technology, Financial, Materials sectors include First Trust NASDAQ-100 Tech Sector Index Fund (QTEC), SPDR S&P Capital Markets ETF (KCE), and VanEck Vectors Steel ETF (SLX).
If you prefer a bullish bias, the Sector Rotation model suggests holding Financial, Industrial, and Materials, in that order. On the other hand, if you are more comfortable with a defensive stance on the market, the model suggests holding Utilities, Technology, and Consumer Goods (Staples/Noncyclical), in that order.
By the way, an assortment of other unique ETFs that happen to score well (i.e., Outlook scores above 90) in our latest rankings include VanEck Vectors Mortgage REIT Income (MORT), PowerShares Dynamic Semiconductors Portfolio (PSI), VanEck Vectors BDC Income ETF (BIZD), US Global Jets ETF (JETS), iShares US Home Construction ETF (ITB), WBI Tactical SMV Shares (WBIB), and Davis Select Financial ETF (DFNL).
Disclosure: The author has no positions ...
more

