
Ranking The Current US Stock Market Drawdown Vs. History
It’s anyone’s guess if the recent rebound in US equities will soon push the S&P 500 Index to a new high. What we do know is that the market has staged a solid bounce so far. For the eight trading days since Christmas Eve’s close, when the S&P’s current drawdown hit bottom, the index is up a solid 8.4%. There’s still a long climb ahead to recover the remaining ground lost since the S&P’s previous peak, set on September 20. To reach that summit the index would have to rally roughly 15% over yesterday’s close (January 7).
Meantime, let’s review the current drawdown from the perspective of history, starting with yesterday’s close, which leaves the S&P 500 roughly 13% below its previous peak.

That’s moderately lighter compared with the -19.8% drop as of Christmas Eve’s last trade, which marks the low point (so far) for the current drawdown.
Using that Christmas Eve trough mark for guidance, let’s compare how S&P drawdowns stack up through history, based on numbers since 1955 for the deepest-25 drawdowns. By that standard, the -19.8% slide through December 24, 2018 ranks as the 11th deepest drawdown (highlighted in blue in the table below). Although the latest tumble has been painful, it pales in comparison to the biggest setback over the past six decades-plus: the biggest drawdown was the -57% monster for 2007-2009.

The next table below ranks the speed of the decline from peak to trough, in ascending order. The latest drawdown was a relatively swift affair, taking only 65 trading days from peak to trough – the 11th fastest slide among the top-25 drawdowns since 1955.

Finally, what does history suggest for the length of recovery for regaining the previous high? The shortest rebound for the top-25 drawdowns was a lightening fast 16 trading days in 1997, although the drawdown, in that case, was relatively light at -9.6%. That was a cakewalk compared with the longest recovery: a weary 1,462 trading days following the 1974 trough.
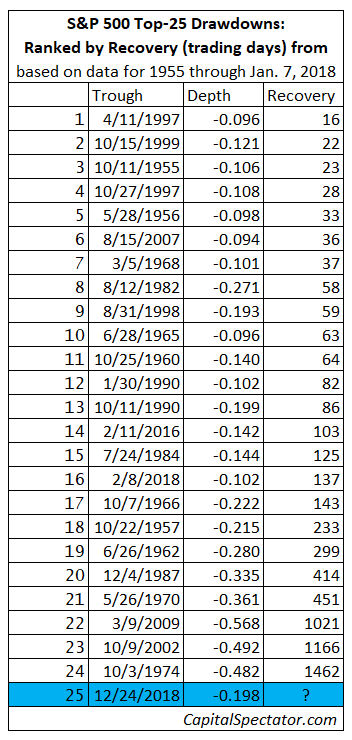
A mere eight days have passed since the recent trough and so it’s far too early to make an informed judgment about how long the current drawdown might last. As usual, much depends on the incoming economic data, the political climate, and many other factors.
Based on futures trading this morning, however, it appears that the S&P’s poised for another gain today, which would bring the recovery length to nine days. Hope springs eternal, but given the current environment, it’s reasonable to keep expectations in check for assuming that the market will quickly reach a new high in the near term.
“Investors are happy to go with the positive trend in the current environment but remain wary of sharp downside reactions given the moves we’ve seen over the last few weeks and months,” advises Nick Twidale, chief operating officer at Rakuten Securities Australia. “Traders are still very much aware that the various geopolitical factors that have been so prevalent in influencing market moves over the last 12 months are still relevant.”
Disclosure: None.


