
Quick Primer On Stock Market Vs. GDP
The stock market booms while GDP staggers along. Why?
For the moment, let’s dispense with the Dow Jones, which has a big multinational component, and inspect a broader market capitalization — the Wilshire 5000 — and nominal GDP.
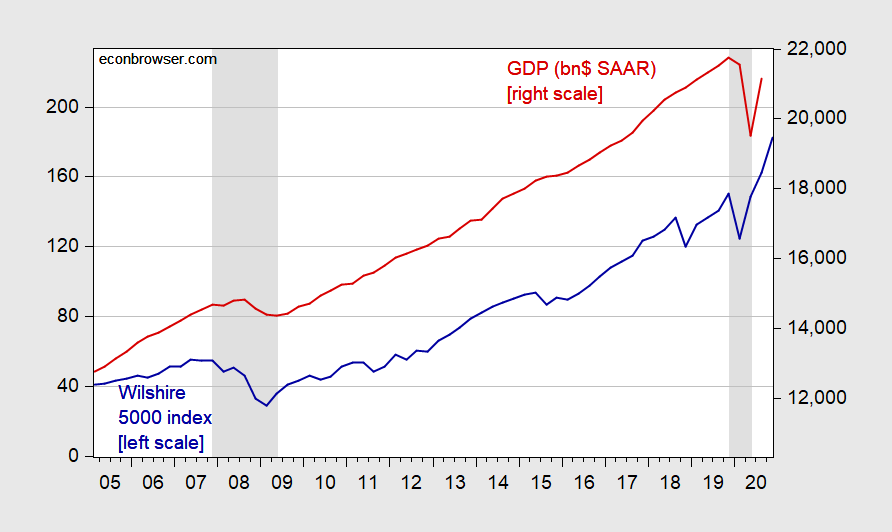
Figure 1: Wilshire 5000 index, end of quarter month (left scale), and nominal GDP in billions$ SAAR (right scale). NBER defined recession dates shaded gray. Latest recession assumed to start at NBER peak, end 2020Q2. Wilshire index for 2020Q4 is December through the 18th. Source: Wilshire, BEA via FRED, NBER.
Notice the divergences in the 2000s, as well as in 2020. Why might this occur, even if the stock market index only covered companies with US revenues?
First, GDP is a flow of current goods and services expenditures within a given period. The stock market valuation is the present discounted value of the expected stream of future dividends from now to the infinite future, for corporations that issue stock (assuming no bubbles). It doesn’t include the revenues for noncorporate.
At the end of 2019, corporations accounted for $14812.1 billion of a total $18960.8 billion nonresidential fixed capital stock (and accounted for $253.1 billion of $23557.1 billion of residential). In other words, only 78.1% of the nonresidential capital stock is represented by the stock market, and only 35.4% of the total (non-residential and residential) capital stock [source: BEA].
The biggest issue is the following – the stock price is a present discounted value:
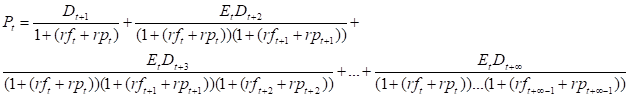
Where P is the stock price, D is the dividend, rf is the risk-free rate, and rp is the equity risk premium. Et is the expectations operator (here using the mathematical, but in general could be the subjective). The above assumes no bubbles.
Notice that everything is time-indexed, so the stock price can change as expectations are revised, as the risk-free rate changes, and perhaps most importantly the equity premium varies (variations of which are sometimes called changes in “risk appetite”). This means that stock prices can fluctuate drastically even if currently observable variables don’t change. The current surge could be because of a low risk-free rate and/or decline in risk premium and/or upward revisions in expected earnings.
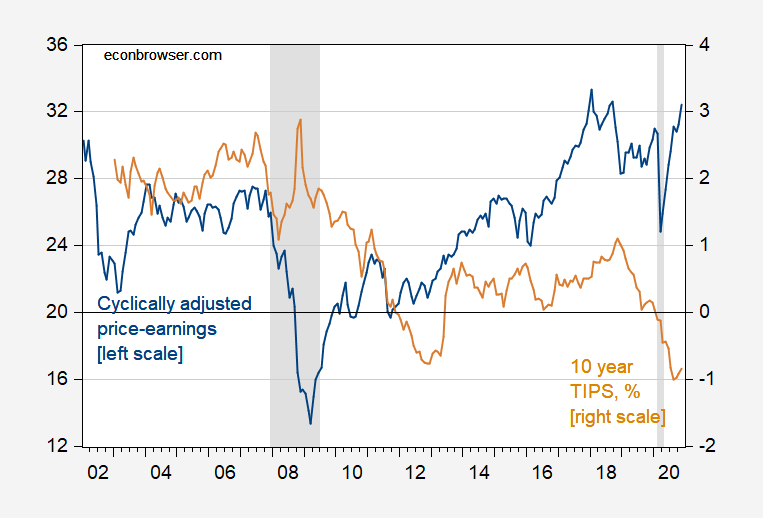
Figure 2: Cyclically adjusted price-earnings (CAPE) for S&P500 (blue, left scale), and TIPS 10 year (brown, right scale). NBER defined recession dates shaded gray. Latest recession assumed to start at NBER peak, end 2020M02. Wilshire index for December is through 18th. Source: Shiller, NBER.
This doesn’t mean that the variations in stock prices are rational, in the sense of full-information rational expectations. As I mentioned, Et in the notation I use above could pertain to subjective expectations. But it would be hard to show definitively irrationality, given market expectations of future outcomes are unobservable. Only actual outcomes are observable (see Shiller; Summers show how much data is necessary to discern efficient markets from big fads).
So, to reiterate – the stock market doesn’t necessarily move in tandem with the economy’s fortunes. Good to remember when looking at this picture.
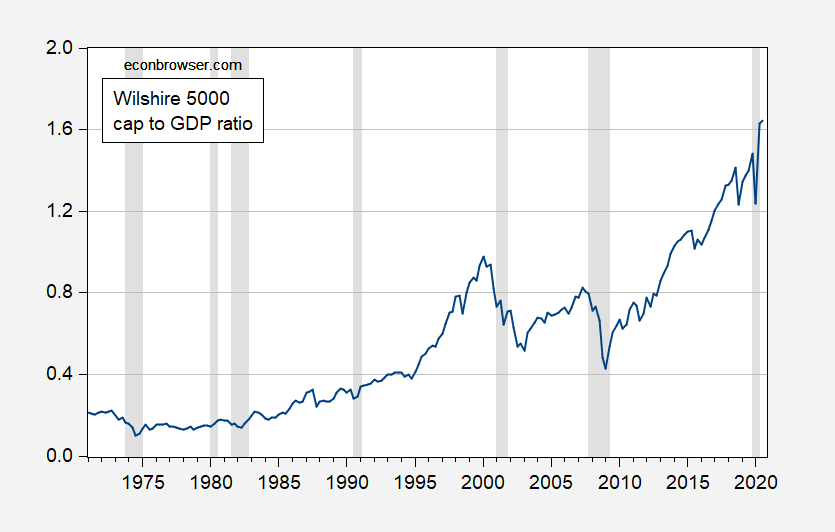
Figure 3: Wilshire 5000 index, end of quarter month divided by nominal GDP (left scale). NBER defined recession dates shaded gray. Latest recession assumed to start at NBER peak, end 2020Q2. Wilshire index for 2020Q4 is December through 18th. Source: Wilshire, BEA via FRED, NBER.
Update, 12/22 6pm Pacific: Willem Thorbecke points out that the “stock market valuation is the expected present discounted value of the stream of future dividends. The discount factor is stochastic also.” He is absolutely right; here is what I should’ve written:

Disclosure: None.


