

Big week for the S&P 500 (SPX), depending on which side of the fence you're leaning of course! The path of least resistance, advancing higher, proved the path taken through mid-week and until all was lost. There was something to be gained from the weekly trading range whether you were bullish or bearish. That has rarely been the case since the March 2020 bear market bottom.
For the trading week, the S&P 500 managed to seek out a loss, but only after rising more than 1% on the year to 3,277. That's where all eyes focused their attention on the likely resistance of 3,300, headlines started to circulate with greater emphasis of bubble-like conditions and the market forced itself to retreat and pause further upside potential.
When it was all "done and said", the S&P 500 fell just 9 points for the week. It proved to be the first down week in the last 5 and yet we hear warning bells ringing in our ears from Thursday to Friday's market close. After being a big winner in 2020, the Nasdaq (NDX) gave back 1.3% on the week. So the emphasis switches to paying close attention to the short-term support levels now. It would not be surprising to see more downside in the days ahead, and ahead of any legislature passing for another round of fiscal relief. Even with such possible downside in focus, however, positioning for that outcome during an uptrend is merely "guessing" what comes next and to what magnitude it is achieved. It's not a good exercise to try and time, position, and gauge the magnitude of correction. This remains especially true in a highly illiquid equity market regime where gap reversals/pivots can prove to render that positioning with losses off of a corrective-low. It's an easier, more on-trend exercise to simply buy dips.

By reviewing the weekly sectors' performance chart above, we recognize that fewer sectors were up during the trading week. Additionally, this marks the 2nd consecutive week whereby both Technology and Communication Services sectors were down while Energy, Financials, Materials, Utilities, Consumer Staples and Consumer Discretionary were all higher for the week. It becomes clear that even though the major averages were down for the week, sector rotation was in-force. In our opinion, rotating out of the more overheated sectors and into those which represent better valuations is a sign of a healthy bull market with investors using discretion. This is not an indiscriminate rally. (Condensed report. Full report at finomgroup.com for subscribers only)
Strong Bullish Trend Remains... Until It Doesn't
For weeks, I've been hearing about the overbought Nasdaq 100 and the heavily weighted top 5 names garnering all the flows, and how that posed a risk to the broader market. Even with the Nasdaq 100 breaking below it's 20-DMA this past week, the broader market only gave up some of it's ground. (NDX 100 chart below)
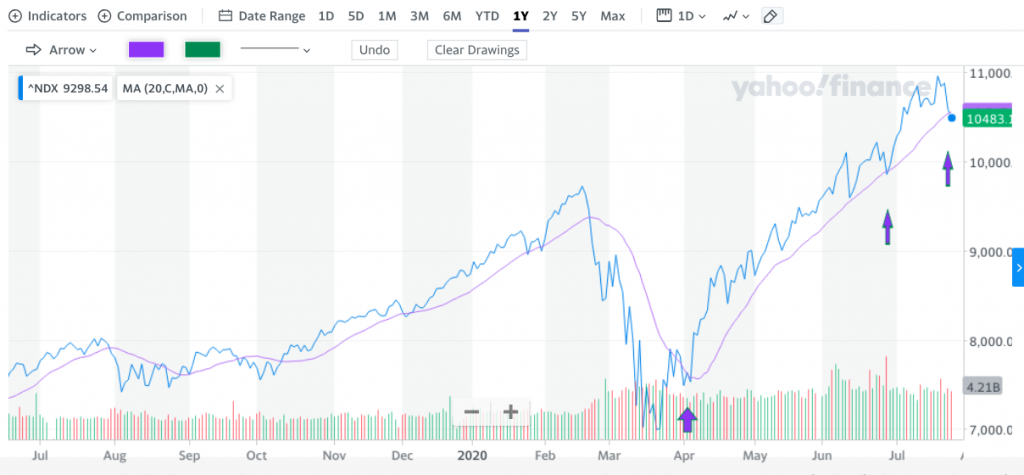
The 1-year NDX 100 chart above identifies a rather consistent pattern for the index to check back to and even break below the 20-DMA, before repeating it's trend of higher highs. Going back to 2019, the same pattern persists and even identifies periods for which the index stays below its 20-DMA for several days if not weeks. As we head into the most critically important tech-reporting week of the year, the way in which these key reports are treated by investors could dictate the path forward for the S&P 500 and Dow Jones Industrial Average (DJIA), at least in the interim.
On April 30, 2020, Apple Inc. (AAPL) reported strong beats on both the top and bottom line. The firm will report again and alongside both Alphabet (GOOGL) and Amazon (AMZN) on July 30th, after the closing bell. A closer look at the NDX 100 chart identifies a severe, rapid drop in the index from April 30th through May 1st, and before a rapid rebound once again took hold of the index.

The Nasdaq 100 dropped from 9,000 down to 8,718 over that 2-day trading period, roughly 3 percent. With the NDX 100 already pulling back ahead of these key mega-cap, tech names reporting in the week ahead, the same type of earnings reaction might be avoided. Having said that, should the results prove to meet and/or beat expectations, any pullback is likely to be bought in short order as some investors take profits while others buy strong fundamentals. If this proves to find a similar pullback as during the Q1 reporting season, in the week ahead, this will likely prove the pullback the market usually finds worthy of near-term support and the impetus for dip buyers to come back into the picture to scoop up relatively "cheap" shares in the tech sector.
Keep in mind something I mentioned just this past week as it pertains to the Technology sector and how it did serve to come to fruition this past week, by halting the uptrend:
"Technology has grown to a nearly 26% weighting in the S&P 500 and Communication Services has risen to nearly 12% of the S&P 500.
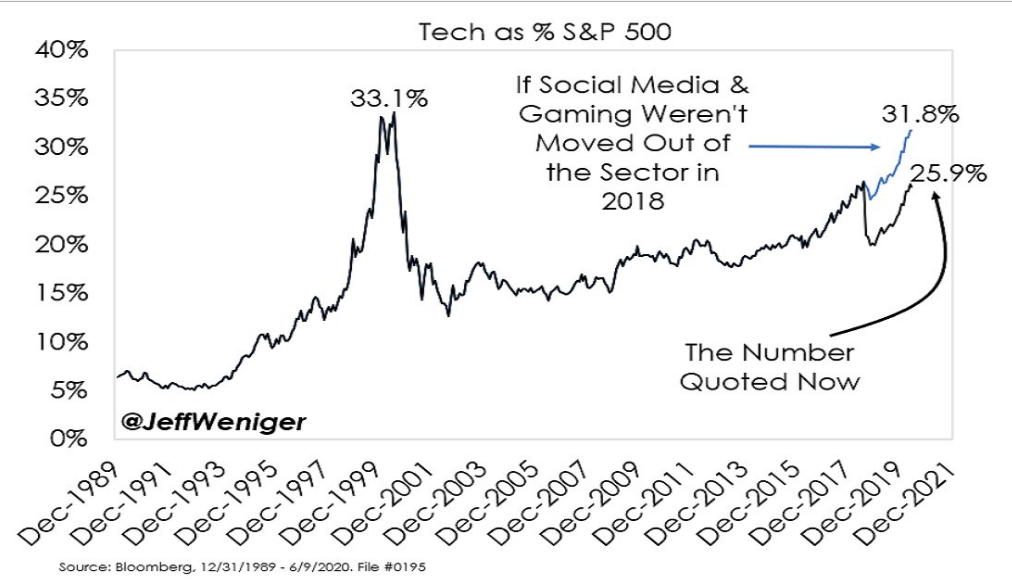
Given the sector weighting for Technology, while it’s all good “work” and seemingly bullish to find the overall market still trending in a bullish manner while Technology and Communication Services succumb to selling pressure, trust that if this persists, the S&P 500 is unlikely to stay on its current path upwards."
Given the size of the Technology sector within the S&P 500, it's great to see some of the steam come out of the technology locomotive, but as it persisted last week, it did prove to halt the uptrend... at least for the time being. Don't overlook these articulations from past reports, as we see them play out in the market with real precision.
In a bull market, and I have offered many ways to define and validate the new bull market over the last 30 days or so, resistance is a focus. From that resistance, we can define where market breakouts occur. In a bear market, support is emphasized and is frequently broken severely. I think we have discovered the key points of resistance for the S&P 500 around the break-even 3,230s for the year. The market tested the positive "waters" above this level nicely this week, spent a day or two above the level, and then decided in favor of consolidating it's gains.
When we look at the S&P 500 to determine strength or weakness we need look no further than the distance above the 50-DMA the index is currently trading. We will look deeper of course, but the chart below depicts overbought conditions for the S&P 500.
With the S&P 500 trading more than 2 standard deviations above its 50-DMA, we almost always find a consolidation period near-term. Also, the selling pressure that culminated the trading week, may prove the beginning of such consolidation that usually coincides with a weaker rate of return for the month of August. (Seasonality, returns table below)

In looking at the table of July average gains over the last 30 years, my how history can prove quite repetitive. The benchmark index came into the month at 3,115 and finished the week up more than 3% at 3,215; a 100 point move month-to-date. We're heading into the final trading week of July, with what has proven to be a historically negative month of returns for the month of August. But wait...

As shown in the LPL table above, August is usually a negative month for the S&P 500 going back to 1950... except during ELECTION YEARS! We'll see if history repeats itself again this election cycle, but this is why we deep dive and gather as much historical data points as possible. If you don't have the right inputs/variables, you'll likely not have the more accurate outcomes/probabilities or expectations.
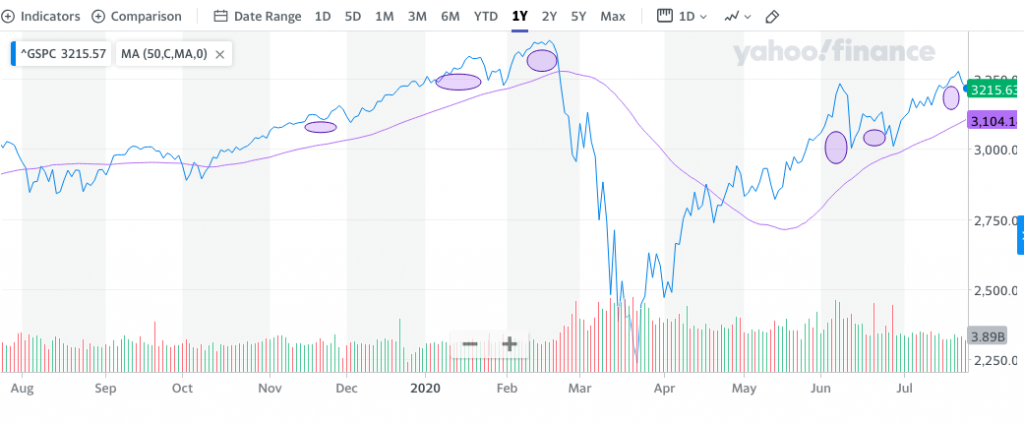
I abhor technical analysis; there I said it! My personal belief is that technical analysis is not black and white, but only, only subjective. We see what we have trained ourselves to see by drawing lines and connecting points on a chart. There are so many stochastics and chart patterns to discern from also, indicating that it is not as scientific as one desires it to be and more of an art form. How do we value such artistic renderings is none other than... that's right, personal subjectivity. With that being said, I don't think the following technical analysis is able to be found on the "inter-web", as my father-in-law likes to call it at 80-years of age. I also think he spends so much time on it in search for its end, as if it were a book with a "The End".

What is outlined in the chart above is nothing more than a recent consolidation zone for the S&P 500 with a bottom around 3,000 and a breakout above 3,230. We're clearly finding the S&P 500 back in the consolidation zone after traveling some 2 STD beyond its 50-DMA, right? Consolidation is normal and to be expected. How much consolidation will be achieved is likely dependent on a plethora of factors from the macro-picture to the technical realm.
Within the consolidation zone, I drew a horizontal line. By drawing a horizontal line we can clearly see higher lows, which led to an inevitable breakout. This is the most advantaged point for which to define the probabilities for a breakout within a consolidation pattern. Technicals have been a driving force behind the new bull market, but even they can give way to greater consolidation if the macro-picture materially weakens.
Now that the breakout has moved back into the consolidation zone we should remain open to the probability of a test of the horizontal line at 3,152ish. Of course, if this happens and we close the week around this level or worse, the returns for the month of July would not prove consistent with the historic average (3.6%). We'll see!
Quite frankly, and I hesitate to say this, but there is little technical concern for the market near-term, which is also a matter of perspective. We shouldn't worry about what it is we can see in the technical patterns given normal and to be expected consolidation, but rather that which we can't see from the macro-fundamentals. Technical analysis allows us to follow what happened in the market, assess what happened in order to determine the probabilities going forward. Technicals are no more a guarantee than the historical studies we disseminate.
As discussed in our weekly State of the Market video and text for Finom Group members (for who I am employed), this past week the NYSE A/D made a new bull market high. This breadth indicator proves that breadth has remained strong underneath the surface of the market and breadth tends to lead price.

So here are some fun facts after hitting a new bull market high for the NYSE A/D line. Keep in mind that breadth will exhaust itself eventually. So let's look at the following charts of the NYSE A/D in the top panel and S&P 500 in the bottom panel.

- NYSE Cumulative A/D is at a new high. A new A/D high has occurred at nearly every >5% fall in SPX, whether SPX was at an ATH (2013-on) or a lower high (2003-07; 2009-13).
- Bottom line, if expressing highs in the NYSE A/D, keep it simple and recognize that such breadth occurs in bull markets. Full stop, as the kids say! You might anticipate breadth exhausting shortly thereafter with some consolidation ensuing.
This past week and despite the major averages producing a negative return, breadth remained at strong levels. Breadth may have weakened week-over-week for some internals, while others strengthen or remained at healthy levels. This is why I also suggest that the technical outlook for the market is of little concern presently.

This was the first time the percent of stocks trading above their 200-DMA finished the week above 50 percent. Even during the week of June 8th, when the S&P 500 hit its former new bull market high, it didn't finish the week with this market internal at such levels.
Although this breadth indicator proved strong on the week, the percent of stocks trading above their 50-DMA did weaken.

The breadth indicator fell from nearly 77% in the previous week to ~71% this past trading week. The determination with this market internal reading is that while the indicator weakened, it remains at very healthy levels, confirming the bullish trend.
Not to be outdone during the trading week where the S&P 500 broke out to 3,277, the number of new highs found a new high reading on 7/22/2020.

The periodic new highs serve to highlight the bullish trend and exonerate the characteristics of a bear market. In bear markets, we have stocks hitting 52-week lows, not 52-week highs. As we can see from the percent of stocks hitting 52-week lows below, that simply isn't happening, as the breadth indicator remains near zero:

The coming week may test investor resolve once again. Investors seem to move from greater certainty to lesser certainty with the ebbing and flowing of market price fluctuations. In terms of technical support, the chart below also lends itself to recognizing near-term consolidation would prove normal and healthy, as the market looks to work-off overbought conditions:

The good news first: All identified moving averages for the SPX chart above are tilted upward. The top line is the 20-DMA, which comes in at 3,174. Given that the NDX 100 has already broken through this level, it may serve as a primary consolidation point for the S&P 500 as well and barring any exogenous, positive headlines, keeping consolidation at bay. The second trend-line in red is the 50-DMA at 3,104. Least we forget our 2009 analogue which found the S&P 500 testing it's 50-DMA along its bullish rebound into 2010? (See 2009 chart below)

Markets do indeed have memories and they find favor with expressing symmetry or revisiting past areas of resistance to provide additional support. If the S&P 500 should break below 3,104, it would likely be in recognition of the initial failure of legislature to pass, a macro-issue of course, but with necessary technical understandings for market support.
For the last 4 consecutive weeks, the S&P 500 has managed to stay within the weekly expected move. This past trading week, the weekly expected move was still elevated at $74/points. For the coming week, the weekly expected move is back up to $76/points.

The weekly expected move is only modestly higher than this past week, as the VIX was only modestly higher this past week, up a scant .62 percent. S&P 500 realized volatility is at its lowest 10-day value since the new bull market began. This is another good sign that the measures taken-up by the Fed and legislative bodies have manifested in more stable market conditions.

The price action is being ruled by the technical patterns presently, and it will be incumbent on investors to remain vigilant and stay focused on this theme while avoiding the headline noise. And make no mistake about it, noise it is. Not my best of sentence structures, but you get the point!
Sustained Recovery Demands Fiscal Relief
The past two weeks were met with few, but relevant economic data headlines. By most measures, the economic data continues to surprise in a big way to the upside. The first piece of relevant economic data released came on Wednesday by way of Existing Home Sales and Mortgage Application data. Total existing-home sales jumped 20.7% from May to a seasonally-adjusted annual rate of 4.72 million in June. Sales overall, however, dipped year-over-year, down 11.3% from a year ago (5.32 million in June 2019). This YoY dip is an issue of supply, not demand!

Total housing inventory at the end of June totaled 1.57 million units, up 1.3% from May, but still down 18.2% from one year ago (1.92 million). Unsold inventory sits at a 4.0-month supply at the current sales pace, down from both 4.8 months in May and from the 4.3-month figure recorded in June 2019.

With low inventory levels and record low mortgage rates, the housing sector has proven to snap back amongst the quickest of the industry sectors in the United States.

“Mortgage applications increased last week despite mixed results from the various rates tracked in MBA’s survey. The average 30-year fixed rate mortgage rose slightly to 3.20 percent, but some creditworthy borrowers are being offered rates even below 3 percent. As a result, these low rates drove a 5 percent weekly gain in refinances and a robust 122 percent increase from a year ago,” said Joel Kan, MBA’s Associate Vice President of Economic and Industry Forecasting. “There continues to be strong homebuyer demand this summer, as home shoppers have returned to the market in many states. Purchase activity increased again last week and was up 19 percent compared to last year – the ninth straight week of year-over-year increases.”

On Thursday, investors were awakened to the first rise for initial jobless claims in 15 weeks. New applications for unemployment benefits, a rough gauge of layoffs, rose by 109,000 to 1.42 million, the Labor Department said Thursday. The figures are seasonally adjusted. Economists polled by MarketWatch had forecast 1.41 million new claims.

An additional 974,999 people sought benefits through a temporary federal-relief program. The number of people receiving traditional jobless benefits through the states, known as continuing claims, fell by 1.1 million to 16.20 million in the week ended July 11.
Many economists are adding up continuing claims, initial claims, PUA, and other pandemic related claims. Since continued claims is the largest component, this reading makes that total look better. Unfortunately, PUA claims rose 19,000 this week to 2.35 million. That means unadjusted claims (including initial and PUA) fell 5%. That’s actually good compared to the past 4 weeks which had increases. It’s the biggest decline in 6 weeks.
Now that we are far enough into July and have enough data, we can suggest that there may prove to be job losses in the July BLS, Nonfarm Payroll report. To be clear, the stock market has already priced that in. It’s easier than usual to predict where the economy is headed because COVID-19 outbreaks equal lower growth/bigger declines. A spike in cases in the hotspots starting in mid-June correlates with the peak on June 8th. Even though the S&P 500 has made a new high, small-cap value stock and the cyclical haven’t passed that high. The small-cap value index is still down 8.5% from June 8th even though the S&P 500 is up 1.4 percent. Since July 9th, small-cap value is up 9.1% as there have been early signs that cases in the hotspots are starting to slow.

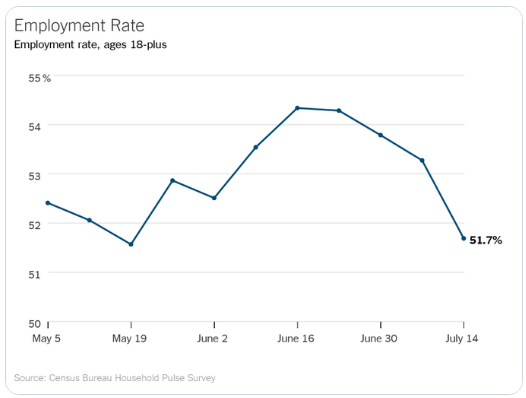
In suggesting negative sentiment for the pending July Nonfarm Payroll report, it is based on the July labor report on continued jobless claims, the economic restrictions recently enforced due to a resurgence in COVID-19 cases, and the civilian employment household survey. The chart above shows the Civilian Employment survey. As you can see, from the June survey week to the July survey week, there were 6.7 million fewer jobs. But we can also suggest the July Nonfarm Payroll report will be negative due to the latest Household Pulse Survey. The chart below shows the household pulse survey has the adult employment rate falling from about 54.3% a month ago to 51.7 percent.
Coupled with all the labor and employment data above, the most recent Kronos Workforce Activity Tracker data shows a marked slowing of shifts worked nationally! (1-week lagged reporting)
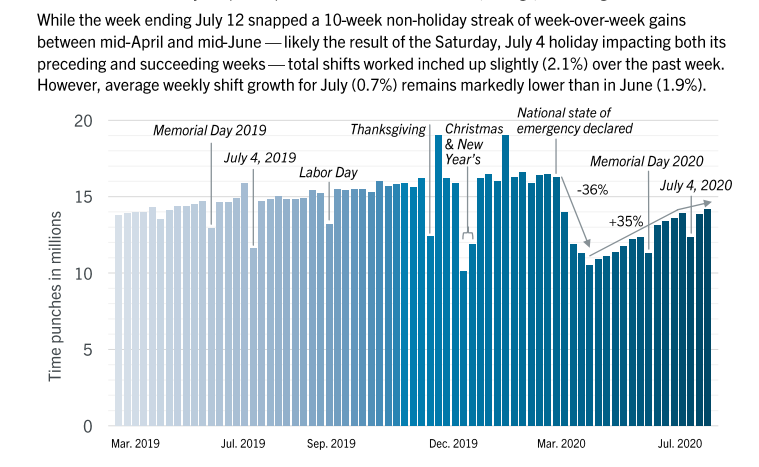
There's going to be a good deal of "high brow" analysis and rhetoric surrounding the next round of fiscal relief and when it will pass. If the stimulus isn’t passed this week or at least signaled for a vote passing by Monday or Tuesday the following week, the upcoming Nonfarm Payroll report will motivate Congress to get something done because the market will likely get quite ugly in between now and then. The market dictates policy reform, it always has and it always will.
Policy initiatives are necessary as the economic recovery is taking shape, but showing signs of stalling, depending on what pockets of the economy we analyze. Most importantly, the greatest driver of economic activity is where we see slowing activity; the consumer.
The consumer is headed in the wrong direction. The two main negative catalysts are the increased economic restrictions due to the recent COVID-19 flare-ups in the south and the west and the anticipated end to the weekly $600 unemployment insurance checks. If you are getting $600 per week from the government and know it is ending this week, you're likely not in spending mode. These people are likely saving for the potential income decline. These people hope they can get a job or that the government can pass another stimulus. They will save what they can until a stimulus gives them cash or employment is found.
Using some high-frequency data points surrounding the consumer and spending trends, we can determine that Redbook same-store sales growth in the week of July 18th fell from -5.5% to -7.5 percent. We might expect negative monthly retail sales growth in July from June and weakening overall sentiment surrounding the Unemployment Insurance benefits. In many ways, we can suggest the current consumer spending climate mirrors that from the Q4 2018 period and the government shutdown that ensued.

Government angst seems to always produce a negative consumer reaction. Chase consumer credit spending growth has stagnated in the low negative double digits, tilting lower in the most recent data series.

Much of the data noted above (shy of Existing Home sales) is more real-time, present data for the month of July. We're analyzing this data in real-time to maintain realistic expectations from the economy and market going forward.
This past week the Conference Board released its June report detailing the latest reading for its Leading Economic Index (LEI), a composite of data series that tend to lead changes in economic activity. Keep in mind, however, this report is a gauge of June's economic activity!
As seen in the LPL Chart of the Day, since the index’s April trough it has posted historically elevated back-to-back monthly increases, rising 2% in June following May’s 3.2% advance. Still, the index has only recovered to an absolute level of 102 compared with January’s all-time high of 112.

"Yesterday’s LEI reading confirms our view that a major economic bottom has already formed and that the recovery is underway," said LPL Financial Chief Market Strategist Ryan Detrick. "But, we are not out of the woods yet. Though we are optimistic, there are still challenges ahead, and we expect a choppier economic march higher in the second leg of this recovery following the initial bounce off the bottom."
For the coming week, the economic data releases are more numerous and interrupted midweek by a Fed rate announcement and press conference from Chairman Jerome Powell.


In my opinion, keeping in mind that everyone has an expectation and opinion on Fed policy initiatives going forward, the Fed has seen its last rate hikes. Rate hikes have proven a fruitless tool in its longstanding and seemingly baseless fight against nonexistent forces known as inflation. This might sound salacious, but inflation hasn't existed in consumer prices since the mid-90s. The only time it rears its ugly head is due to extreme depressions in economic activity such as we had briefly in 2008-2009.
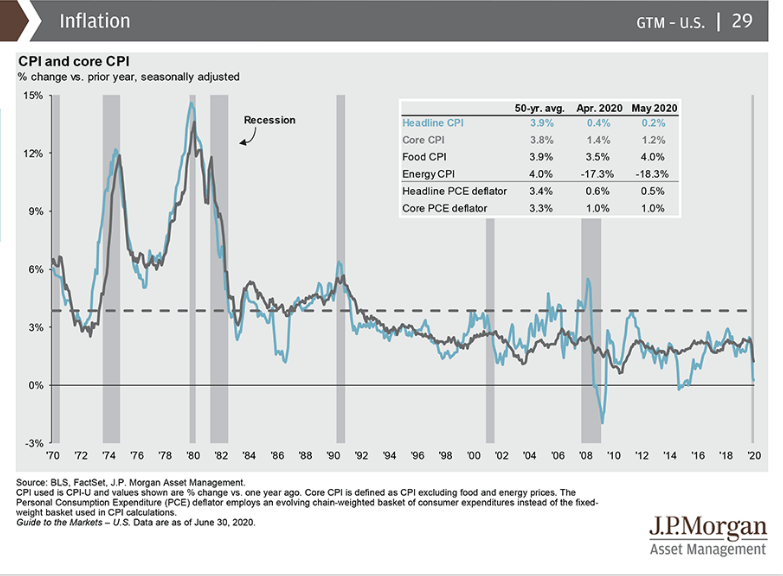
As shown in the CPI data provided by J.P. Morgan above, the index for consumer prices has been flagging lower for more than 25 years. Can we please stop with the whole inflation nonsense. Ergo and to my earlier point, to the degree the Fed has aimed to fight inflation by raising rates, only to lower them shortly thereafter, I think the Fed is on the cusp of a new paradigm with monetary policy.
Keep in mind that the Fed has a dual mandate: Maximum Employment and Price Stability. Prices have been stable and slowly moving lower for over 25 years, mostly due to the impact of price transparency brought about by the information technology era and the rise of e-commerce. Knowing that this trend is cemented and there is no way backward, this understanding further lends to the belief that the Fed will embark upon a new monetary policy paradigm that does not include rate hikes. But how do they deliver such a message?
The question seems simple and innocuous enough, but in reality the market may have a different understanding and assume that a "zero bound" Fed means the Fed believes it is fighting deflation. In my opinion, again, yield curve controls or rate caps are likely to prove a more effective means for governing monetary policy along the price stability mandate. If not rate caps, then simply raise the inflation target beyond what is "likely" achievable. Let's face it, the Fed's 2% inflation target has only been met, briefly, a couple of times over the last decade or so. So push it to a higher range, where it won't likely be achieved and so rate hikes prove unnecessary? Goldman Sachs (I consult for Goldman Sachs London PB) mirrors such an opinion...
Goldman “We think the FOMC will eventually switch to outcome-based forward guidance that delays liftoff until the economy achieves both full employment and 2% inflation, a goal that we do not expect to be met until roughly 2025.
We expect the FOMC to adopt average inflation targeting, effectively raising the inflation goal to a 2-2.5% range when the economy is at full employment.”
Here's another point to consider as it pertains to rates and general Federal Reserve activity going forward, as an investor: What about the balance sheet and the eventuality for the Fed to unload these assets it has purchased and swapped? Won't the stock market fall again like it did in 2018 when the Fed was selling assets?

The market didn't fall because the Fed was contracting its balance sheet. The market fell because the Fed was contracting its balance sheet, raising rates and foolishly indicating rate hikes and balance sheet reductions were on autopilot. That's a whole lot of lessons learned by the Federal Reserve in 2018 concerning how to NOT conduct monetary policy.
We have a lot taking place in the coming week, but maybe that is also why the market has decided to begin consolidating its recent gains. The economic picture remains somewhat uncertain, but definitively dependent on both monetary and additional fiscal relief. It is very likely that fiscal relief is passed by the first week of August at the latest, but signaled to be agreed in principle sooner than that date. We'll be happily surprised if the legislature is negotiated, agreed to and voted in favor of passage, however, this week.
Moreover, the economy has likely found its bottom and will slowly improve into 2020 and beyond, barring another exogenous event. In the coming week, market participants will get a first look at Q2 GDP, which is widely believed to have contracted from 33-38%, depending on the body forecasting the outlook.
- J.P. Morgan: "We are lowering our 2Q real GDP growth forecast from -31.0% to -32.5% saar ahead of next Thursday’s [data]. .. We recently had been noting some downside risk to our forecast and we continue to see growth tracking below our prior estimate .."
- Goldman: "Following this morning’s data, our Q2 GDP tracking estimate remains unchanged at -33% (qoq ar). We expect -29% in the initial vintage of the report, reflecting incomplete source data and non-response bias."
Earnings Outlook and Fund Flows
In discussing all the economic data above, one big takeaway to extrapolate from a litany of annoying details is this: THE MARKET ALREADY KNOWS!! Investors/traders who choose to fight a bullish trend are not only fighting the trend with what they believe to be negative, backward data, but they are fighting the inevitable return to growth, which the market IS reflecting. This is further exampled by the market knowing that earnings estimates were simply taken too far to the downside by analysts for the Q2 reporting period. The market knew this was going to be the case, and thus has been trending as if it would be proven.
According to FactSet, 26% of the companies in the S&P 500 have reported actual results for Q2 2020. In terms of earnings, the percentage of companies reporting actual EPS above estimates (81%) is above the five-year average. In aggregate, companies are reporting earnings that are 11.4% above the estimates, which is also above the five-year average. In terms of sales, the percentage of companies reporting actual sales above estimates (71%) is above the five-year average. In aggregate, companies are reporting sales that are 3.0% above estimates, which is also above the five-year average.
Insight/2020/07.2020/07.24.2020_EI/S&P%20500%20Earnings%20Above%20In-Line%20Below%20Estimates%20Q2%202020.png?width=920&name=S&P%20500%20Earnings%20Above%20In-Line%20Below%20Estimates%20Q2%202020.png)
The blended earnings decline for the second quarter is now -42.4%, which is smaller than the earnings decline of -44% last week. Positive earnings surprises reported by companies in the Health Care and Information Technology sectors were mainly responsible for the decrease in the overall earnings decline during the week. One sector (Utilities) is reporting year-over-year earnings growth. The other 10 sectors are reporting a year-over-year decline in earnings.
Insight/2020/07.2020/07.24.2020_EI/S&P%20500%20Earnings%20Growth%20Q2%202020.png?width=920&name=S&P%20500%20Earnings%20Growth%20Q2%202020.png)
Looking toward the quarters ahead and 2021 analysts predict:
- A (year-over-year) decline in earnings in the third quarter (-24.0%) and the fourth quarter (-12.3%) of 2020.
- They also project a return to earnings growth in Q1 2021 (12.7%).
- The forward 12-month P/E ratio is 22.2, which is above the five-year average and above the 10-year average.
- During the upcoming week, 192 S&P 500 companies (including 12 Dow 30 components) are scheduled to report results for the second quarter.
Recall what I offered in last week's Research Report:
"Finom Group believes there is ample enough evidence to support a continuation of earnings and sales beats through the Q2 2020 reporting season, as the previous forecasts are being proven too pessimistic and without recognition of the strong sales and earnings power provided by healthy, on-trend businesses residing in the Information Technology, Financial, Health Care and Communication Services sectors of the economy. Having said that, we do not anticipate earnings season to be a driver of future price gains for the broader indices, as we can see from the early reaction to earnings reports, investors have potentially priced in such beats. Lastly, but not least, there is an interesting potential risk to the market that will take shape on July 30th with 3 of the biggest market cap earnings reports delivered on that day: Apple, Amazon and Alphabet (Google). That will prove an interesting and market-moving event in the after hours session."
I will reiterate this forecast going forward as we continue to envision a litany of earnings and revenue beats ahead. For the coming week, here are some of the key earnings reports to be delivered:

There it is folks; Thursday's after-hours deliverance of quarterly reports from Apple, Alphabet and Amazon. Ahead of the results this past Thursday, a Goldman Sachs call to sell Apple started the parade of analysts telling investors the market was overvalued. The "technicals" took over, and once the S&P 500 broke below the intraday low posted on Wednesday, the selling intensified. None of that action should come as a surprise given the 5% rally in the S&P 500 since July 1. As usual, the media rolled out all of the "headlines" along with the bearish analysts to fit the downside price action. Many of these same analysts who are giving advice now have missed the entire rally off the lows. Yet for some reason, we are supposed to follow their lead. I'm perplexed?
Let's not forget that the same Goldman Sachs downgraded Apple to a Sell back in mid-April of this year. How did that work out?

If you throw a stick in any direction you're going to hit upon a bad analyst call. But as I've said since early 2019: "There's no good time to sell AAPL shares, there's only a better time to increase exposure to AAPL shares in your portfolio."
As it pertains to weekly fund flows and according to Lippper, for the second week in three, equity ETFs witnessed net inflows, taking in $10.0 billion for the most recent fund-flows week. Authorized participants (APs) were net purchasers of domestic equity ETFs (+$9.5 billion), injecting money for the third week in four. For the second consecutive week, non-domestic equity ETFs witnessed net outflows, although they attracted just $441 million this past week. SPDR S&P 500 ETF (SPY, +$4.2 billion) and iShares Russell 2000 ETF (IWM, +$1.7 billion) attracted the largest amounts of net new money of all individual equity ETFs. At the other end of the spectrum, Utilities Select Sector SPDR ETF (XLU, -$721 million) experienced the largest individual net redemptions, and SPDR Dow Jones Industrial Average ETF (DIA, -$585 million) suffered the second largest net redemptions of the week.
Investor Takeaways
While we don't know exactly what the Senate will offer in its proposal for a second round of aid to citizens when it releases the proposal Monday, here is what the proposal would include as of the end of this past week.
- It would extend enhanced federal unemployment insurance but “based on approximately 70% wage replacement,” according to Treasury Secretary Steven Mnuchin. Senate Majority Leader Mitch McConnell, R-Ky., has described a continuation as “temporary.” As of earlier this week, Republicans were considering paying out the supplemental aid through December, sources told CNBC.
- The plan would send another round of direct payments to Americans. It is unclear now if the bill would keep the same terms of eligibility as the stimulus checks approved in March ($1,200 to individuals and $2,400 to couples, which started to phase out at an average income of $75,000 per person and ended completely at an average income of $99,000). On Friday, McConnell said, “we do envision another round of direct cash payments particularly those making $40,000 a year and less in the hospitality industry.”
- It would protect businesses, doctors and universities from coronavirus-related lawsuits except for cases of “gross negligence and intentional misconduct,” according to McConnell. He has described the provision as a “red line” in talks with Democrats.
- The legislation would include $105 billion to help schools restart, with at least part of the funding contingent on them opening their doors in the fall.
- The bill would authorize what Republicans have called a targeted second round of Paycheck Protection Program loans for small businesses hit particularly hard by the pandemic. Mnuchin said the aid could go to companies whose revenues have fallen more than 50%.
In addition to those pieces of the plan, Republicans have said their bill will include $16 billion in new funds for coronavirus testing and tax incentives to encourage companies to rehire workers and adopt safety measures.
This is going to prove a very, very noisy week folks! Fed rate announcement and press conference, first look at Q2 GDP, likely back-and-forth headlines surrounding legislative negotiations and the BIG 3 earnings after the bell on Thursday. The good news is that beyond this week's busiest week for earnings season, the worst of the earnings trough is likely behind us. Analysts have increased confidence for global markets’ earnings. In fact, their 1-month moving average of net monthly upgrades continues to ratchet higher!

The next topic considers the U.S. Dollar, something we rarely discuss, but has become of increasing relevance. Over the last couple of weeks, I've been highlighting the relevance of a weaker U.S. Dollar in the Finom Group Trading Room with members. The basis for our USD discussion is that it proves favorable for multi-national corporations and the S&P 500 as some 45% of revenues are derived overseas. The strong USD had negatively impacted corporate results in the past. So when the USD is weak, it proves a tailwind for multinationals and the S&P 500.
The Euro’s move to a 1-year high versus the USD this week is a good excuse to briefly revisit the global value of the greenback. To help frame the discussion, let’s look at the Fed’s measure of the trade-weighted dollar back to 2006. On a compositional basis, here are this index’s current key weights according to DataTrek:
- Euro: 18.9%
- Chinese yuan: 15.8%
- Mexican peso: 13.5%
- Canadian dollar: 13.4%
- UK pound: 5.3%
- Rest of world: 33.1%

- The 2020 COVID Crisis spiked the USD to a level 19% higher than the 2008 – 2009 Financial Crisis, and “peak dollar” in each period coincided EXACTLY to the day of the S&P 500 low for both events. On March 9th, 2009 the trade-weighted dollar index closed at 106.01. On March 23rd, 2020 the dollar index hit an all-time high of 126.47. It is 5.5% lower today.
- We see a weaker dollar as confirmation that global investors feel the worst of the COVID Crisis has passed and validates the rally in equities since March. A weaker USD is not a warning sign about a sudden turn lower for U.S. equities. History tells us this would be a nonsensical counter-argument.
- If the USD’s post-Financial Crisis experience repeats itself, the USD should fall by another 13-14% over the next 2 years. The total move from 2009 to 2011 visible in the chart above was 19%, and we’ve seen a 5.5% drop already.
Moreover and if we look beyond the Fed's trade-weighted dollar, the Bloomberg Dollar Spot Index, a more diversified basket than the commonly cited DXY Index, is nearing a critical uptrend line. A break of this support could mean that weakness seen over the past few months is more than just an unwinding of the flight to safety. The index was down roughly 2% for the week and tracking toward its fourth straight weekly loss.
This isn’t just a technical story though. According to LPL Financial, rising twin deficits have historically been followed by a weaker dollar, meaning the fundamentals support this move in the dollar as well.

According to LPL Chief Market Strategist Ryan Detrick, “a weaker US dollar may be a slight negative for US consumers’ buying power, but for investors’ portfolios the implications are overwhelmingly positive. Commodities are rallying, US multinational companies benefit from foreign buyers being able to afford more of their goods, and international stocks do well as their underlying currencies appreciate.
Recent history bears this out. The last calendar year that saw a significant dollar decline was 2017 when the Bloomberg Dollar Index fell more than 8%. The S&P 500 Index rallied more than 19% on a price return basis."
When things seemingly can't get any worse than a pandemic-driven, self-induced economic shutdown, a great many variables trough and have little room for anything but improvement. I think that is what the stock market is reflecting. It recognizes the worst has come home to roost, and in the eyes of the storm, necessary and sufficient measures have been introduced to combat the economic situation for the better. While the road traveled from here will not prove without bumps and divots, they will prove less devastating than an economic drawdown in activity of greater than 30%, the forecast for Q2 2020 GDP.
Let us be reminded in a hotly negotiated legislative week, that as we spoke of the Cares Act 2.0 demands from the pandemic caused recession and job losses, there is still an ample amount of initial fiscal relief to be put to work folks. Only $2trn of the $3trn Cares Act bill has been spent to-date.
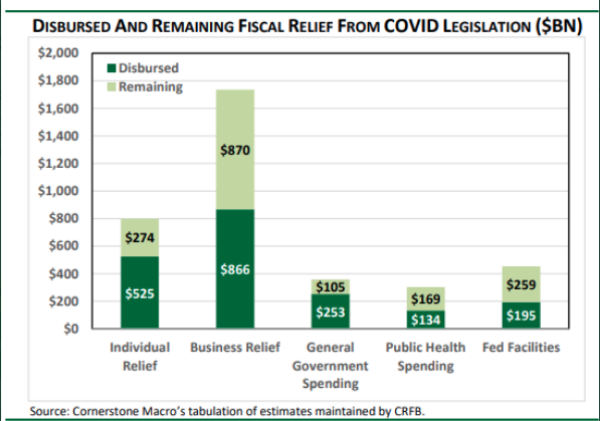
Simply put, it has been made extremely and abundantly clear that deficits don't matter as much as they used to and the Fed has ample bullets to fire should the market demand/need more liquidity. As an investor, you take advantage of these "spectacles of negligence", as the bears would characterize them to be. We don't blind ourselves to the realities of the situation, we take advantage of the opportunity afoot. While I would tend to agree with the bears that such high deficit levels carry unknown risks, to date there has never been a lack of ability to fund and/or finance U.S. debt as the world has proven there to be an insatiable appetite for U.S. debt. Forecasting the doom of America based on debt levels has proven a foolish forecast for decades now.
As I round out this weekly report I can't help to refocus on those tech earnings and the back-to-back weekly declines in the technology sector as the Nasdaq 100 breaks through and closes below it's 20-DMA on Friday this past week. The majority of companies have been reporting better than expected EPS and revenues this earnings season, as previously noted. After a 1-week negative reaction to such beats, most of these positive surprises have been greeted with rising stock prices since. One exception, though, appears to be a large-cap tech. The latest examples this week include Microsoft (MSFT) and Intel (INTC). While both stocks reported better than expected EPS, sales, and guidance, their earnings reports have been met with selling pressure.
The sell the news reaction we're seeing so far in tech is the result of two things, in the opinion of Bespoke Investment Group's Paul Hickey. First, the stocks have run so much heading into earnings season that the bar was set extraordinarily high. Second, valuations. The chart below shows where the current P/E ratios of S&P 500 sectors stand relative to their 10-year averages. Currently, the S&P 500 is in the 99.9th percentile relative to all other periods in the last ten years, and that high reading is being driven by lofty valuation in Consumer Discretionary (99.8th percentile) and Technology (99.6th percentile).

Like I discussed at the top of this weekly Research Report; there is nothing wrong with letting a little steam out of the locomotive engine to relieve the upside pressure. The good news for either MSFT, Netflix (NFLX) or INTC thus far is that the results and guidance were strong. I would be of the opinion that these stocks will find a near-term trough and trend higher soon enough. MSFT and NFLX have a strong probability of trading to new highs by year-end barring an exogenous event, based on the aforementioned quarterly reports and guidance.
Akin to the sentiment I shared above, Mad Money host Jim Cramer offered a like-minded sentiment.

“If you want to own these stocks right now, you’ve got to be willing to take some pain. You’re going to have to watch the rest of the market catch up a bit to them while they decline in value. But at some point, they’ll make a comeback, because these are indeed the best companies on Earth.
All these Big Tech stocks trade together, and when you kick off earnings season with such disappointing action, well, it doesn’t bode well for the rest of the group. Long-term investors in these stocks should not be too concerned about any potential selling in these stocks. It just might be that they’re coming into the quarter “too hot". So far nothing that's been reported suggests there is anything wrong with their fundamentals."
So it's not such a bad thing that the big-cap tech names are selling off ahead of their earnings on Thursday. Either way, these names are fundamentally sound with on-trend business models that contribute to a significant portion of the S&P 500 earnings on a quarterly basis. They have huge buyback programs and solid balance sheets that shouldn't be denied by investors. Any weakness, in my opinion, will prove short-lived. I would anticipate the most scrutinized report to come from Alphabet, given it's display ad revenue leverage, but we shall see come Thursday.
In my view, the shape of the earnings recovery over the next few quarters matters less than the equity risk premium and the state of share buybacks. (The equity risk premium, ERP, is the additional return that investors expect to earn over Treasury bonds or the risk-free rate of return.)
On the latter front, it's a bit disconcerting that the pace of announced buybacks for 2020 has not picked up yet in recent weeks. Normally it would have hooked up by now. The chart below shows that we are now in line with 2011 and 2012 in terms of the pace of buybacks. This could all change by Q3's end though and should a vaccine find FDA approval for application.
Announced share buybacks
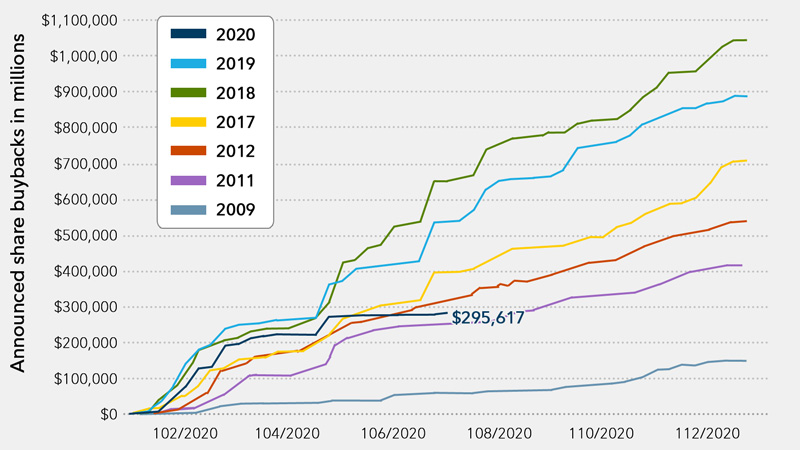
Investors are willing to pay up for stocks presently, as they are clearly anticipating a vaccine sometime after the election. This would likely give way to a heavy increase for announced share buybacks that would flood headlines in a way that they did shortly after the Tax Reform Act of 2017. Remember, the market is a forward-looking discounting mechanism it has been in discount mode since the March 23rd bottom. Do you care to argue otherwise, based on all the negative headlines? Have a safe and healthy trading week folks and here is to looking forward with a telescope instead of a microscope.
Comments
Log in or sign up to join the conversation.