
+22K vs. Bloomberg consensus of +46K, down from December (rev’d) +37K. Alternative business cycle indicators incorporating these figures show the labor market growth at near zero:
(Click on image to enlarge)
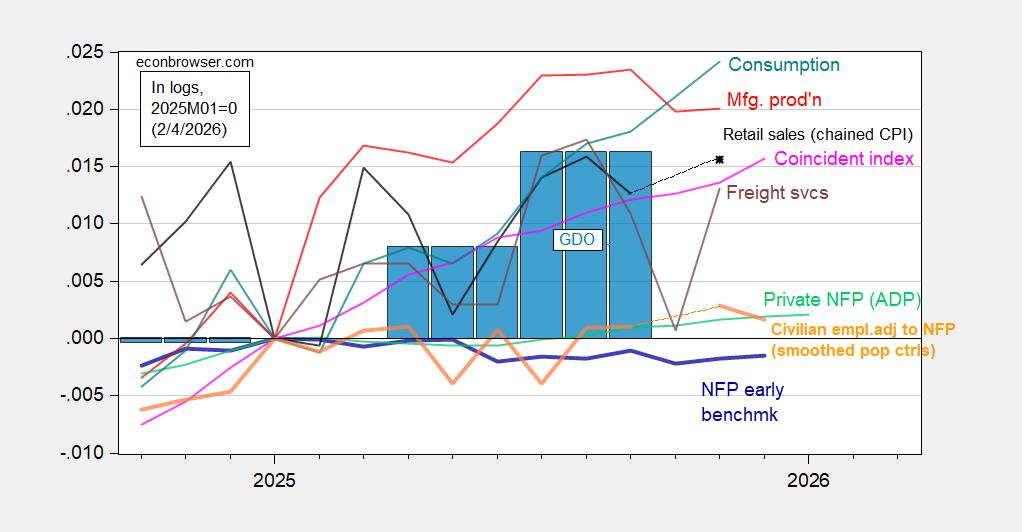
Figure 1: Implied Nonfarm Payroll early benchmark (NFP) (bold blue), civilian employment adjusted to NFP concept, smoothed population controls (bold orange), manufacturing production (red), consumption (light blue), real retail sales (black), freight services index (brown), and coincident index (pink), GDO (blue bars), all log normalized to 2025M01=0. Source: Philadelphia Fed [1], Philadelphia Fed [2], Federal Reserve, BTS via FRED, BEA 2025Q3 updated release, and author’s calculations.
On the other hand, with revisions to benchmarks, the small firm employment/large firm employment dynamic has reversed, such that small firm employment is now growing faster than large firm employment.
(Click on image to enlarge)
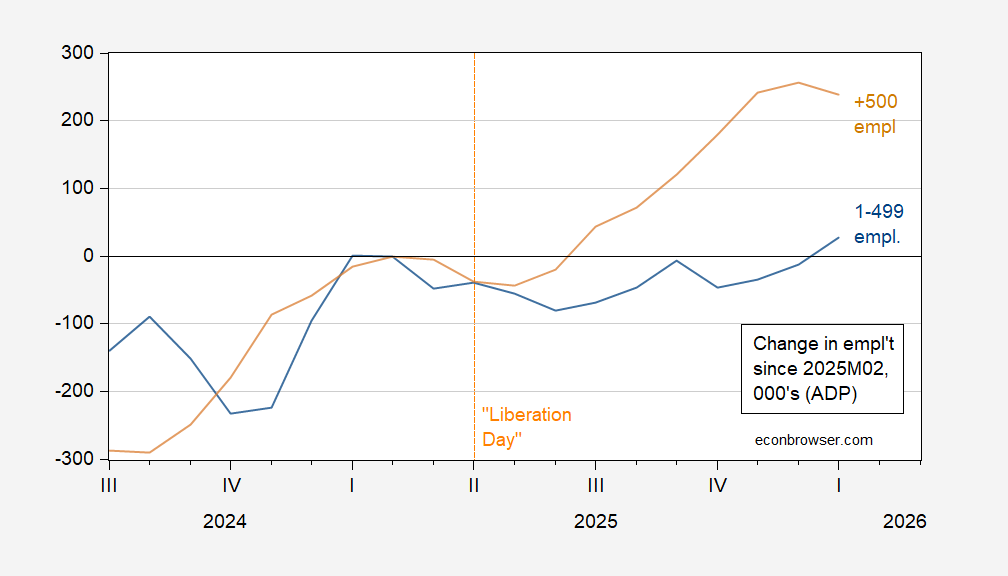
Figure 2: Cumulative change since 2025M02 in employment in firms with employment > 500 (tan), employment 1-499 (blue), in 000’s, s.a. Source: ADP January 2026 release, and author’s calculations.
Moving to manufacturing, the sector which the current administration has touted as being on the recovery, has shown employment loss relative to January 2025 (in contrast to the earlier vintage which indicated an employment gain — see this post).
(Click on image to enlarge)
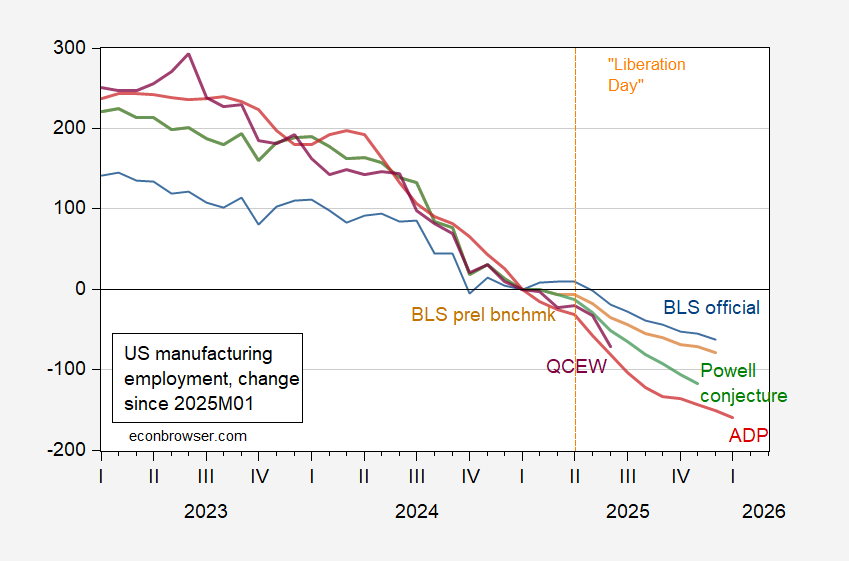
Figure 3: Change since 2025M01 in manufacturing employment from BLS (blue), from implied preliminary benchmark (brown), in Powell conjecture prorated applied to implied preliminary benchmark (green), QCEW covered manufacturing seasonally adjusted using X-13 (in logs) by author (purple), and ADP (red), all in 000’s, s.a. Source: BLS via FRED, BLS, ADP, and author’s calculations.
Addendum:
The benchmark revision makes the 2025 employment gain smaller:
(Click on image to enlarge)
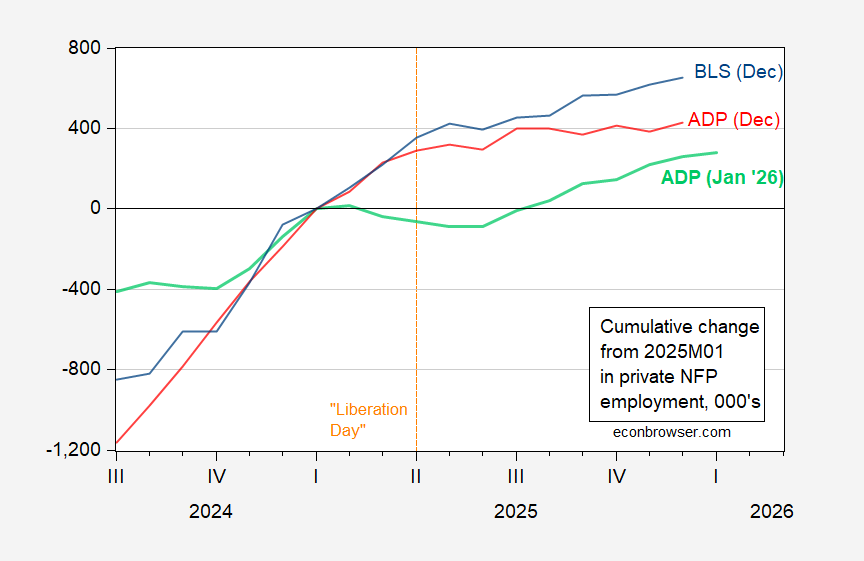
Figure 4: Cumulative gain in ADP private nonfarm payroll employment, January 2026 release (light green), December 2025 release (red), and BLS/CES December release (blue), all in 000’s, s.a. Source: ADP via FRED, ALFRED, BLS, and author’s calculations.
The official BLS series incorporating the preliminary benchmark revision (not shown) looks pretty close to the ADP pre-benchmark revision series (red lie).
More By This Author:
When Tariffs Hit HomeBusiness Cycle Indicators In The Absence Of 2026M1 Employment
Nowcasting “Core GDP”


Comments
Log in or sign up to join the conversation.