
Price Wars Heat Up Among Cell Providers As Apple Looms Over All
Fewer consumer items promote more frustration that a cable TV package or a cell phone contract. Somehow, some way, telecommunications giants have slowly but surely turned up the heat until many households find they are paying two, three, four-hundred dollars a month--or more--for phone and cable service. That's a car payment, a student loan payment, and--in some areas--a rent or a house payment. Realizing that you are spending $4000/year for cable, internet, and phone service can be a real eye opener when you're calculating a family budget.
To combat this expense, we hear a lot about "cutting the cable" via services such as Hulu and Netflix, low cost/no contract cell providers such as Page Plus and Trac Phone, and other methods of reducing monthly telecommunication service bills. But, it is tough to deal with what are essentially monopoly utilities in most markets.
One of the biggest problems for cell phone users is the fact that the popular hardware-- the smart phones that bring our social media into every moment of the day, are fairly expensive despite their diminutive size. Retail cost of the latest 64gb iPhone runs more than $600. iPads with LTE capability unlocked cost more than $700. That's a big up front cost. and once you have the coveted device, you are stuck in a long-term contrct. And-to add insult to injury--often over-charged by your provider.
Cell carriers have been using that high-entry price to their advantage by subsidizing device purchases for consumers, locking them into longer-term contracts, and jacking up rates to compensate for the "free" smart phones. Of course, you can find lower cost carriers with no contracts such as Virgin Mobile, but those deals typically demand that you purchase the smart phone up front at your own expense. That's a non-starter for many consumers due to the economics.
Up until now, all parties except the consumer have benefited from the situation. Manufacturers like Apple get a big boost by making deals with major carriers. Carriers benefit via longer-term contracts and higher charges to consumers. But, according to today's Wall Street Journal, that may be changing.
T-Mobile, a division of German giant Deutsche Telekom, has announced a new pricing model where iPhone hardware will be "leased" to customers for fees ranging from $5-10/month for base model iPhones with the possibility of purchasing the phone outright after 18 months. T-Mobile's plan is similar to those of other carriers like AT&T, Verizon, and Sprint, but it provides the lease and purchase outright option for a cheaper cost and in shorter time.
These cheaper lease/purchase options have to be considered in light of the fact that Apple has also been offering consumers financing for iPhone devices in an effort to bolster sales and--a key point from the cellular carrier perspective--without requiring a cell-phone contract with a participating carrier. Apple wants to keep its market share, and keep its bottom line strong by making sure the iPhone retains supremacy in the market.
Despite these new plans, it remains clear that the best option, cash permitting, is to purchase the devices outright and then find a low-cost carrier that offers the desired data plan at the most competitive rate. But many will be unable to do this and will still need help if they want the latest smart phone. T-Mobile, which has been cutting prices in an effort to improve market share, is currently offering the best deal amongst the major carriers in the US for those who cannot afford to completely cut their cord, buy a phone, and search for a low cost data provider.
Here is our latest data on the various cell phone providers and Apple.
|
Ticker |
Company Name |
Market Price |
Valuation |
Last 12-M Return |
1-M Forecast Return |
1-Yr Forecast Return |
P/E Ratio |
Sector Name |
|
APPLE INC |
113.4 |
-6.79% |
12.21% |
1.01% |
12.18% |
12.66 |
Computer and Technology |
|
|
T-Mobile |
17.45 |
22.88% |
12.69% |
-0.04% |
-0.46% |
25.92 |
Utilities |
|
|
SPRINT CORP |
4.4 |
-16.58% |
-35.29% |
-0.73% |
-8.74% |
N/A |
Utilities |
|
|
AT&T INC |
32.27 |
-12.16% |
-9.10% |
0.45% |
5.35% |
12.74 |
Utilities |
|
|
VERIZON COMM |
44.43 |
-14.79% |
-11.46% |
0.49% |
5.88% |
11.86 |
Utilities |
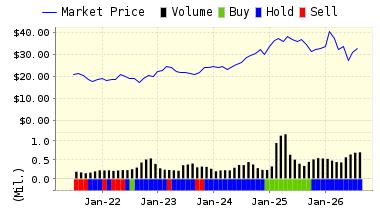
Below is today's more in-depth data on DTEGY:
Deutsche Telekom is Europe's largest communications company and one of the largest communications carriers worldwide. Through T-Mobile, Deutsche Telekom's mobile telephony subsidiary, and through other subsidiaries and investments, Deutsche Telekom serves mobile telephony customers worldwide. Deutsche Telekom offers its customers a complete range of fixed-line voice telephony products and services.
Recommendation: ValuEngine continues its HOLD recommendation on DEUTSCHE TELEKOM for 2015-09-22. Based on the information we have gathered and our resulting research, we feel that DEUTSCHE TELEKOM has the probability to ROUGHLY MATCH average market performance for the next year. The company exhibits ATTRACTIVE Company Size but UNATTRACTIVE P/E Ratio.
|
ValuEngine Forecast |
||
|
Target |
Expected |
|
|---|---|---|
|
1-Month |
17.44 | -0.04% |
|
3-Month |
17.65 | 1.15% |
|
6-Month |
18.02 | 3.24% |
|
1-Year |
17.37 | -0.46% |
|
2-Year |
21.42 | 22.77% |
|
3-Year |
16.98 | -2.70% |
|
Valuation & Rankings |
|||
|
Valuation |
22.88% overvalued |
Valuation Rank |
|
|
1-M Forecast Return |
-0.04% |
1-M Forecast Return Rank |
|
|
12-M Return |
12.69% |
Momentum Rank |
|
|
Sharpe Ratio |
0.21 |
Sharpe Ratio Rank |
|
|
5-Y Avg Annual Return |
5.30% |
5-Y Avg Annual Rtn Rank |
|
|
Volatility |
25.33% |
Volatility Rank |
|
|
Expected EPS Growth |
60.40% |
EPS Growth Rank |
|
|
Market Cap (billions) |
79.15 |
Size Rank |
|
|
Trailing P/E Ratio |
25.92 |
Trailing P/E Rank |
|
|
Forward P/E Ratio |
16.16 |
Forward P/E Ratio Rank |
|
|
PEG Ratio |
0.43 |
PEG Ratio Rank |
|
|
Price/Sales |
0.98 |
Price/Sales Rank |
|
|
Market/Book |
1.99 |
Market/Book Rank |
|
|
Beta |
1.09 |
Beta Rank |
|
|
Alpha |
0.15 |
Alpha Rank |
|
Market Overview
|
Summary of VE Stock Universe |
|
|
Stocks Undervalued |
61.63% |
|
Stocks Overvalued |
38.37% |
|
Stocks Undervalued by 20% |
26.3% |
|
Stocks Overvalued by 20% |
12.99% |
Sector Overview
|
Sector |
Change |
MTD |
YTD |
Valuation |
Last 12-MReturn |
P/E Ratio |
|
-1.51% |
-0.17% |
8.76% |
6.38% overvalued |
13.14% |
31.49 |
|
|
-1.60% |
-0.88% |
-4.03% |
6.12% overvalued |
-10.27% |
17.44 |
|
|
-0.97% |
-0.63% |
-4.64% |
1.13% overvalued |
-3.57% |
23.40 |
|
|
-1.39% |
-1.49% |
-2.15% |
0.92% undervalued |
-1.60% |
23.04 |
|
|
-1.17% |
-0.92% |
1.22% |
0.95% undervalued |
-3.72% |
26.17 |
|
|
-1.12% |
-1.03% |
-6.87% |
2.25% undervalued |
-1.40% |
22.49 |
|
|
-0.94% |
-0.75% |
-2.60% |
2.25% undervalued |
-4.43% |
16.53 |
|
|
-1.42% |
-2.31% |
-10.02% |
3.60% undervalued |
-9.21% |
20.65 |
|
|
-1.53% |
-1.81% |
-5.19% |
3.75% undervalued |
-5.30% |
27.74 |
|
|
-1.73% |
-2.08% |
-8.89% |
4.83% undervalued |
-9.17% |
21.04 |
|
|
-1.65% |
-2.85% |
-3.32% |
6.33% undervalued |
-4.16% |
20.89 |
|
|
-1.38% |
-2.40% |
-10.22% |
11.76% undervalued |
-15.63% |
18.01 |
|
|
-1.95% |
-2.75% |
-13.04% |
12.09% undervalued |
-13.66% |
15.95 |
|
|
-2.60% |
-3.69% |
-10.48% |
12.55% undervalued |
-11.48% |
14.20 |
|
|
-2.04% |
-8.58% |
-20.99% |
14.19% undervalued |
-48.95% |
24.60 |
|
|
-2.49% |
-5.51% |
-18.66% |
17.47% undervalued |
-30.80% |
20.59 |
Valuation Watch: Overvalued stocks now make up 38.37% of our stocks assigned a valuation and 12.99% of those equities are calculated to be overvalued by 20% or more. Three sectors are calculated to be overvalued.
Disclosure: None.
ValuEngine.com is an independent research provider, producing buy/hold/sell recommendations, target price, and valuations on over 7,000 US and Canadian equities every trading ...
more

