
Price To Forecasted Hope
There are countless ways to evaluate equities, and they all have glaring flaws. Equity valuation is not a science with predictive formulas. It is subjective, and the formulas themselves and the interpretation of the results rely on an estimate of what the future holds.
Some models use historical data under the assumption that the current trend will be predictive of the future while others use forecasts that differ from the past. It is a rare occasion that the past neatly maps out the future or, for that matter, that anyone accurately predicts the future. No model represents the holy grail of investing, but understanding their inputs and outputs can reveal a lot about relative valuations and the sentiment of a market. As investors, we need to take into account all types of valuation techniques and their assumptions, especially those that may not confirm our current investment thesis.
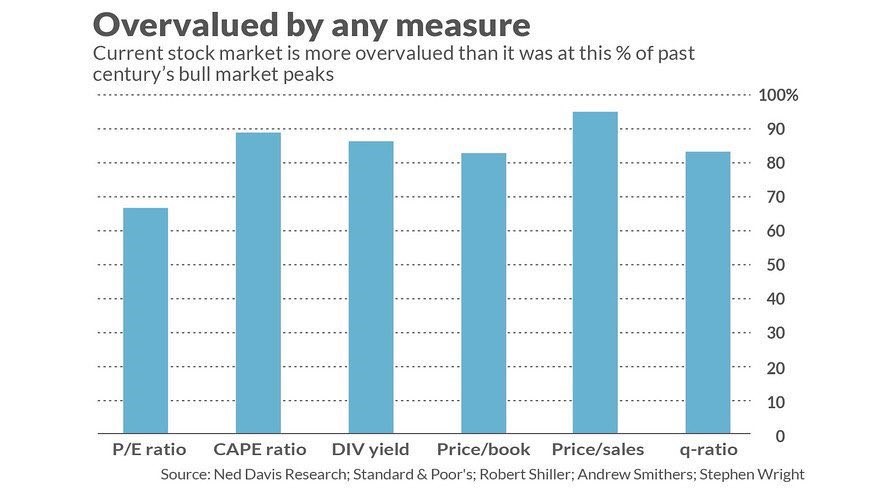
Differences between various valuation models allows one to construct a bearish or bullish outlook simply by choosing the model that produces the appropriate outcome. Recently, Price to Forward Earnings (P/fE) has been flashing a buy signal and has been used by many investors as evidence that stocks are cheap. At the same time, as shown below, most other traditional valuation models are pointing to a market that is anywhere from 65% to 95% overvalued. What gives?
Choosing E?
Price to earnings is one of the most popular forms of equity valuation. It is a logical approach given that earnings, the profits available after all expenses, are ultimately what investors are buying. The basic price to earnings ratio (P/E) simply tells us what multiple the market is paying for profits. For instance, a P/E of 20 means investors are willing to pay 20 times the current level of earnings to own shares of the company. Theoretically, in this case, if a company’s earnings are flat for eternity, the investor will earn a 5% (1/20) annual return. If future earnings exceed current earnings, the return will be greater than 5%, and the return will be less than 5% if the opposite is true about earnings..
To provide a framework allowing for the comparison of current P/E valuations to prior valuations or valuations between other stocks or indexes, the E (earnings) in the ratio can be historical, recent or forecasted.
Our preferred method, Cyclically Adjusted Price to Earnings (CAPE), compares today’s price versus inflation-adjusted earnings over the preceding ten year period. If you believe that future earnings growth will follow the longer term trend of years past, this valuation tool provides a dependable relative valuation metric.
The most commonly used P/E is based on earnings from the trailing twelve months (TTM). The reason we are not as comfortable with this approach is that, at times, one year earnings periods can differ markedly from prior periods due to one-off events. For instance, earnings over the last 12 months are considerably higher than the previous few years due to the corporate tax cut. As a result, TTM P/E is lower, but does that make stocks cheaper? That is not a trick question and can be answered yes or no depending on other factors. Regardless of your preference, both TTM and CAPE P/E ratios use earnings data that has occurred in the past.
Another popular way to calculate P/E uses estimates of forward earnings for the next 12 months. Theoretically, this approach is the best of the three methods. When you are buying a stock or an index, it is the earnings in the future that matter, not those in the past.
While the price to forward earnings (P/fE) ratio seems like the smartest approach, it is much harder to use as predicting earnings can be very difficult. In fact, the point at which one needs to be most vigilant about avoiding overpriced equities often is the time when misplaced confidence is highest in equities. Of greater concern, most investors rely on forward earnings forecasts from Wall Street. While Wall Street banks may employ the best analysts and have access to knowledge that you and I do not, they are biased. To put it bluntly, Wall Street banks and brokers make money by selling stocks.
This opinion is not cynical, this is how the world works. McDonald’s, for instance, is always quick to point out the health benefits of their salads, but have they ever tried to dissuade customers from ordering a Big Mac, jumbo fries and a large Coke? In fact, they entice customers to order that exact “super-size” combination through pricing deals.
Data Supporting our Cynicism
Given that Wall Street is in the business of selling stocks, they tend to be optimistic. The graph below points this out by showing the difference between forecasted earnings and the true earnings that were released 12 months after the forecasts. The gray-shaded area plots the percentage difference.
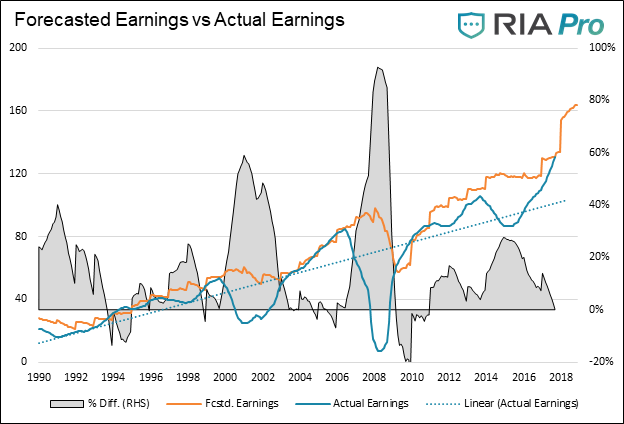
Note the following:
- On average, forward earnings expectations are 16.5% higher than actual earnings
- During the last three recessions, forward earnings were 50% greater than actual earnings
- Forward earnings are greater than actual earnings 85% of the time
The ebbs and flows of earnings from quarter to quarter and year to year graphically hide some of the perpetual optimism. The next graph uses the historical earnings trend line (dotted blue) from the graph above to compare to forward estimates. This modification of the first graph allows us to compare more reliable earnings trends to forecasts.
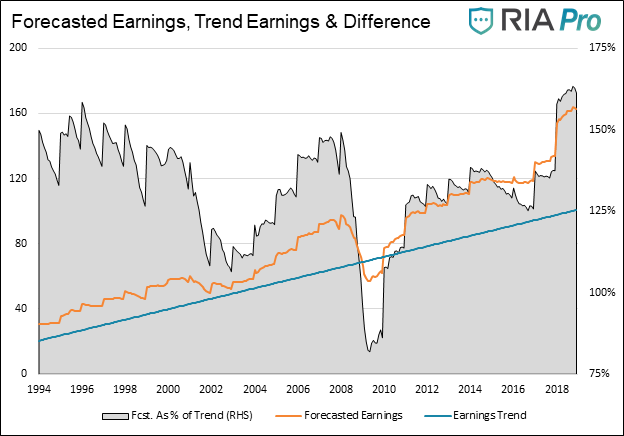
As shown, forward forecasts have been consistently overly optimistic since 1994 except for the 2008/09 recession. While the reliability of optimism is worth stressing, the level of current optimism, represented by the gray shaded area showing the percentage difference, indicates that current forward earnings estimates are the highest they have been compared to the longer term earnings trend over this 25-year period.
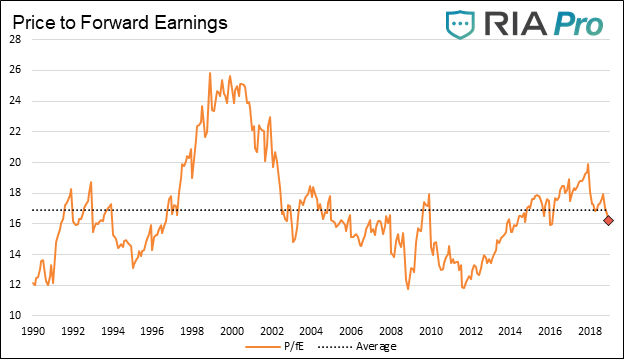
Current P/fE
The graph below charts P/fE. As shown, the current P/fE level is below the average of the last 28 years and, dare we say, cheap.
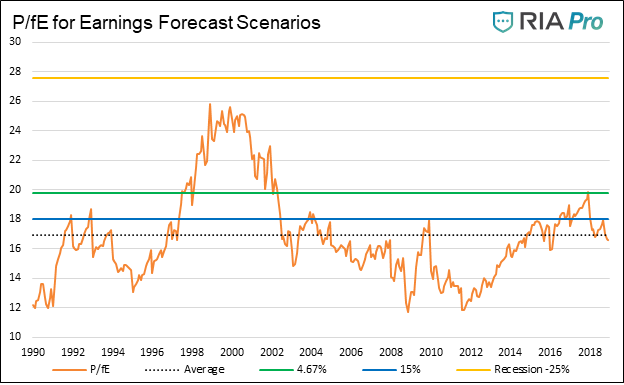
Given this set of information, stating that stocks are cheap on the basis of forward earnings and P/fE alone is foolish. The graph below contrasts current P/fE with various one-year earnings forecasts. To help pick one of the horizontal lines associated with different annual earnings growth rates consider:
- 2012-2017 earnings grew at 4.67%
- 2018 grew at 21.77%
- 2019 expected to grow at 20% (1.56 vs 1.30)
We should also note that growth associated with the tax cuts have a one-year shelf life. While earnings may be higher as companies pay fewer taxes, the growth rate of those earnings should revert towards trend levels as they are married to economic activity.
As shown, forward P/fE is only as good as the forecast. Even if earnings grow at 15% in 2019, which would be impressive, the ratio goes from below to above average. In more pessimistic scenarios, such as a reversion to the longer-term trend growth or a mild recession, the ratio becomes very expensive. Traditionally, this is what happens as the economy moves in to a recession but Wall Street analysts are slow to react.
Summary
- The growth benefits of the tax cut are not recurring
- Will buybacks continue to boost EPS?
- Revenue growth has been running 4%, can corporate profit margins keep expanding?
- Forecasted earnings are overly optimistic 85% of the time
- Forecasted earnings have never predicted a recession or a big drop in earnings
- In the event no recession emerges, then wage pressures are likely to negatively impact earnings and margins
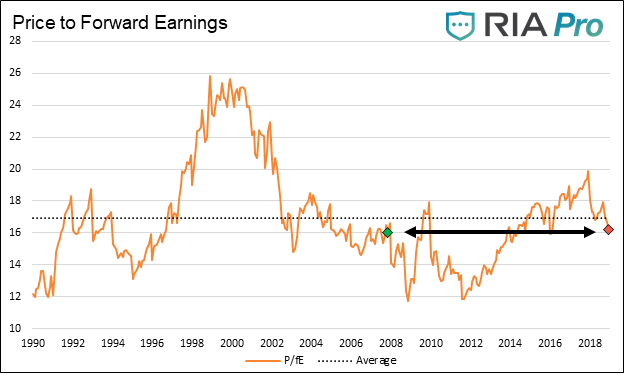
Instead of restating our thoughts on the current “value” exposed by P/fE, we leave you with a simple thought and graph. At current levels, price to forecasted earnings are as “cheap” as they were in November 2007. Oddly enough, the National Bureau of Economic Research (NBER), which is responsible for identifying the dates when U.S. recessions begin and end, mark December 2007 as the beginning of the Great Recession. That was not a good time to own “cheap” stocks.
Disclaimer: Click here to read the full disclaimer.


