
Price-Momentum Implied Forecasts: REITs/Real Estate
This week’s year-end momentum profile of the major asset classes concludes today with a review of REITs/real estate, which follows updates on stocks, bonds, and commodities. The analytical lens is a two-part focus: 50- and 200-day moving averages, augmented with trailing one-year return (252 trading days). The goal: develop intuition about the near-term outlook for various slices of the global markets, based on a set of proxy ETFs. Since the agenda is analyzing price trends (as of Dec. 29), we’ll strip out distributions and look at price-only data, using charting resources via StockCharts.com.
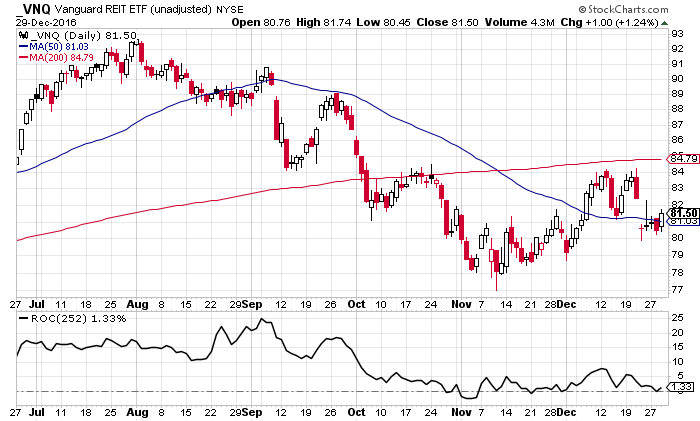
Let’s begin with a broad measure of the market for US real estate investment trusts (REITs). The trend is a bit wobbly at the moment for Vanguard REIT (VNQ). Although the fund is holding on to a slight one-year gain in price-only terms, the recent dip of the 50-day moving average below its 200-day counterpart raises a warning flag.
A cautious reading also applies to the residential slice of US REITs (iShares Residential Real Estate Capped (REZ)).

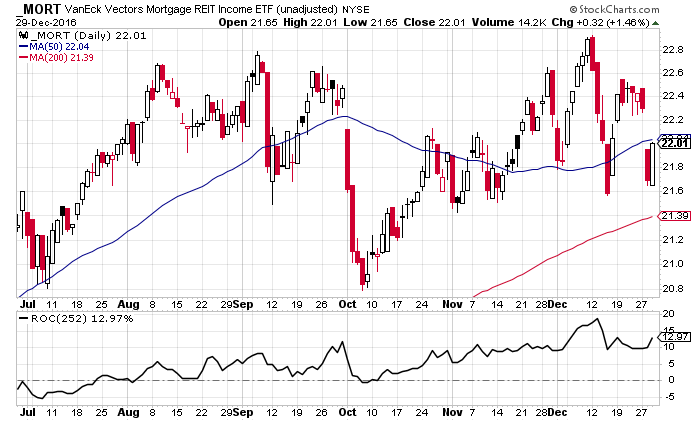
By contrast, a bullish trend prevails for another sub-category of US securitized real estate—mortgage REITs. VanEck Vectors Mortgage REIT Income ETF (MORT) is currently posting a solid 13% price-only one-year return and the fund’s 50-day average is comfortably above the 200-day average.
Moving on to foreign markets, a bearish trend is conspicuous in recent history for Vanguard Global ex-US Real Estate ETF (VNQI). The ETF has been sliding in recent months and the technical profile implies that the fund is headed for a weak start in the new year.

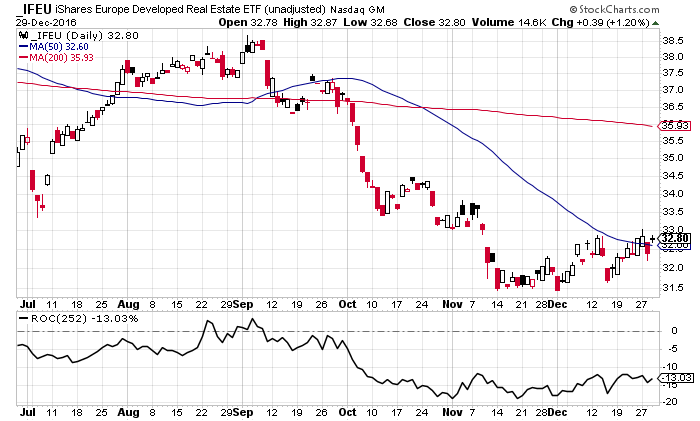
Selling also dominates trading for iShares Europe Developed Real Estate (IFEU). The fund’s price only one-year change is firmly negative and the 50-day average has gapped well below the 200-day average.
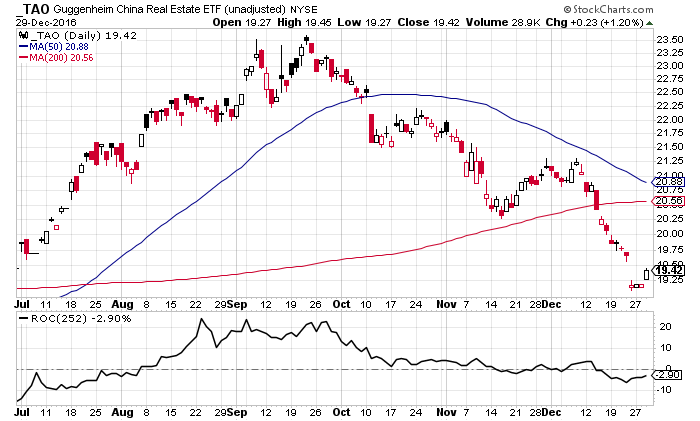
Finally, negative momentum appears to be accelerating in China’s real estate sector, based on price-only data for Guggenheim China Real Estate ETF (TAO). The one-year return is slightly negative and the downward-sloping 50-day average may soon fall below the 200-day average.
Disclosure: None.


