
Potential VIX Breakdown Near-Term Opportunity For Equity Bulls, But Volatility Curve In Contango Medium-Term Risk
VIX is on the verge of a breakdown. After sustaining over 20 for a year, it risks losing that level in the sessions ahead. A decisive breach opens the door toward mid- to high-teens near term. This will have taken place at a time when several other metrics are screaming caution medium term.

.
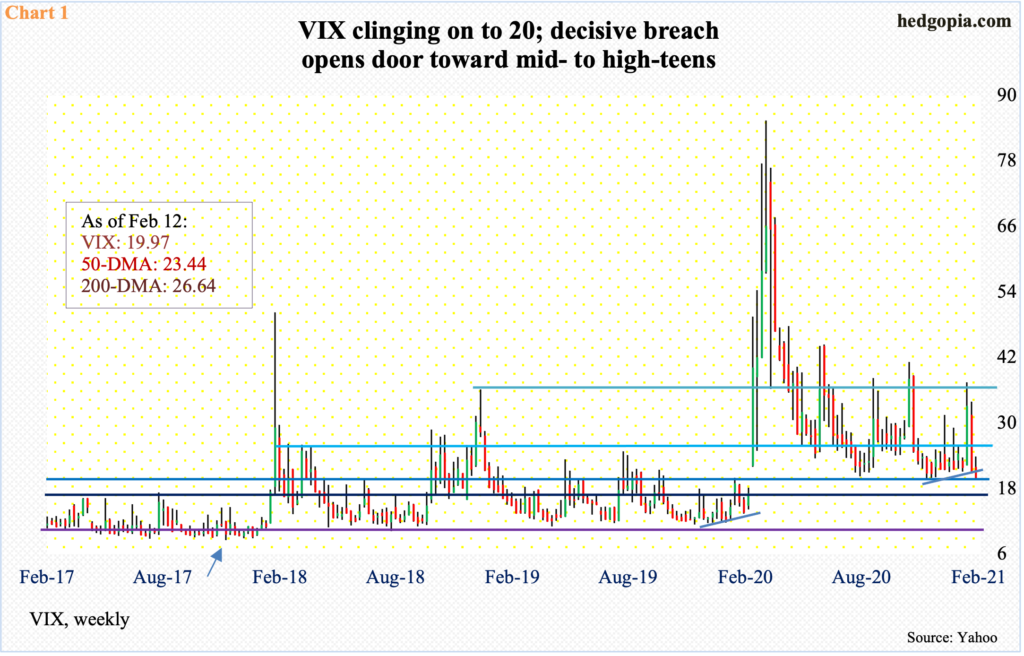
For the first time since February 24 last year, VIX (19.97) closed under 20 last Friday. Back then, the volatility index printed higher lows for over two months before breaking out of low-20s and ultimately peaking at 85.47, which was the second highest print ever (VIX).
This time, too, VIX made higher lows since late November last year. Volatility bulls’ attempt to rally off of it got capped at 37.51 late January. The drop from that high has been quick, with a slight breach of the trend line.
More importantly, a decisive breach of 20 opens the door toward mid- to high-teens, where VIX routinely found itself in before last February’s breakout. For months, the index remained suppressed in 10-11, with a record low of 8.56 in November 2017 (arrow in Chart 1).
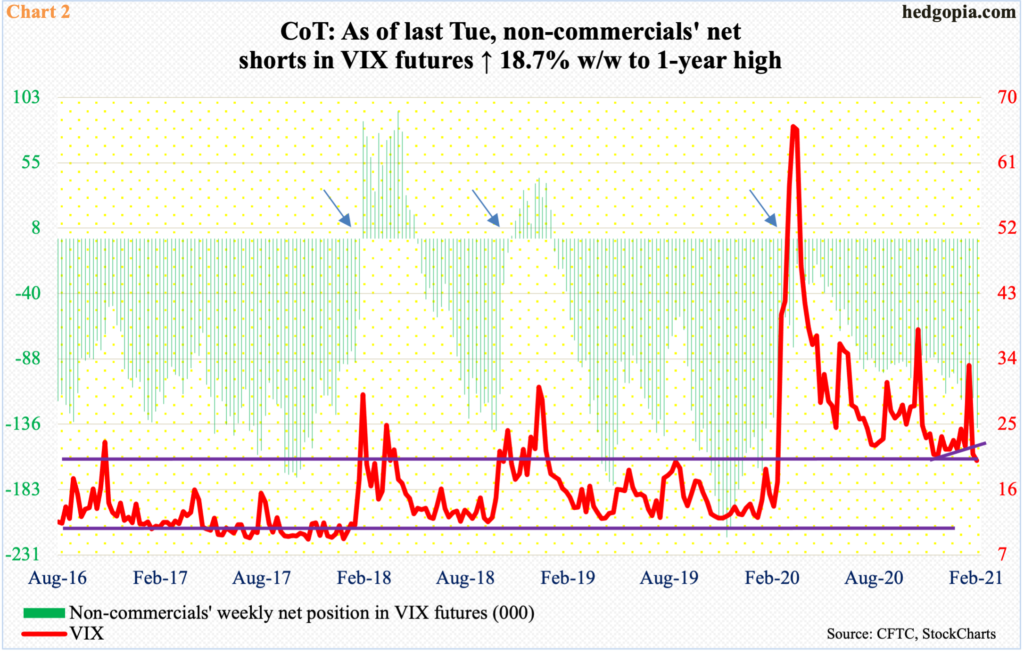
In essence, VIX went from north of 37 to sub-20 in merely two weeks. The speedy drop has emboldened the bears. In the futures market, non-commercials as of last Tuesday were sitting on 138,317 net shorts in VIX futures, which was the highest since late January last year (Chart 2).
So far this year, these traders have gradually added to their holdings. At the end of last year, they were net short 98,550 contracts. VIX was 22.75 then. Directionally, they are on the right track and will do well once VIX decisively breaches 20 and heads toward its prior comfort zone.
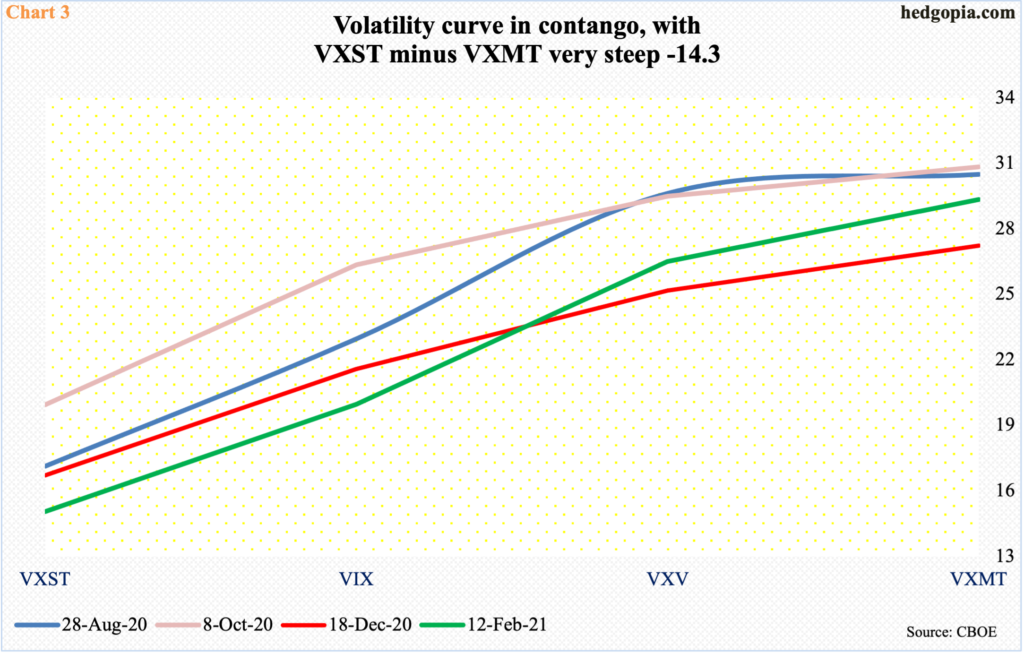
In this scenario, the volatility curve could steepen a little bit more, as premium continues to come out faster in the short end.
VIX measures expectations for 30-day volatility using S&P 500 options. VXST does the same but only goes out to nine days, VXV to 90 days and VXMT to six months. The curve already is in contango.
As is evident, the shorter end of the curve is losing premium faster than the long end. Basically, no one feels the need to buy protection in the near term. Last Friday, the spread between VXST and VXMT was minus 14.29! The other three instances shown in Chart 3 are all over minus 10, with a spread of minus 13.36 on August 28 last year. This was two sessions before the S&P 500 peaked on September 2 to quickly correct north of 10 percent.
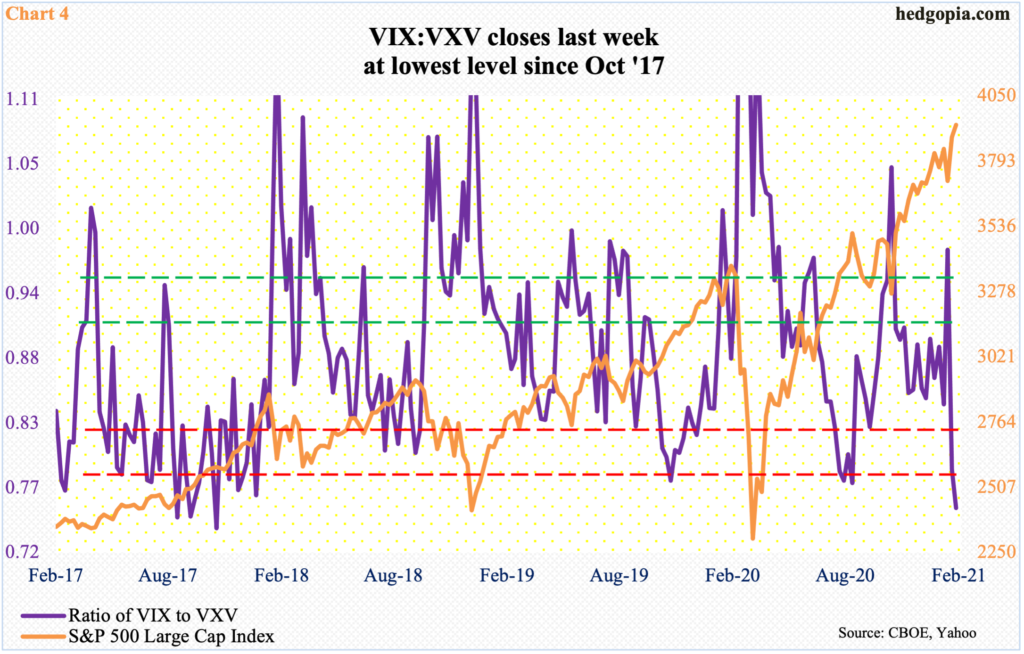
Another way of looking at this is the ratio of VIX to VXV.
Last Friday, the ratio closed at 0.754, which was the lowest since October 2017 (Chart 4). This is deep oversold territory. That said, unwinding may or may not begin right away. In the past, the ratio dropped into oversold territory and went sideways for weeks. This is what volatility bears – or equity bulls – are counting on.
Last week’s is the second 0.70s reading in succession, the first time this has happened since early August. Back then, the ratio went sideways for a couple more weeks before volatility perked up and equities sold off.
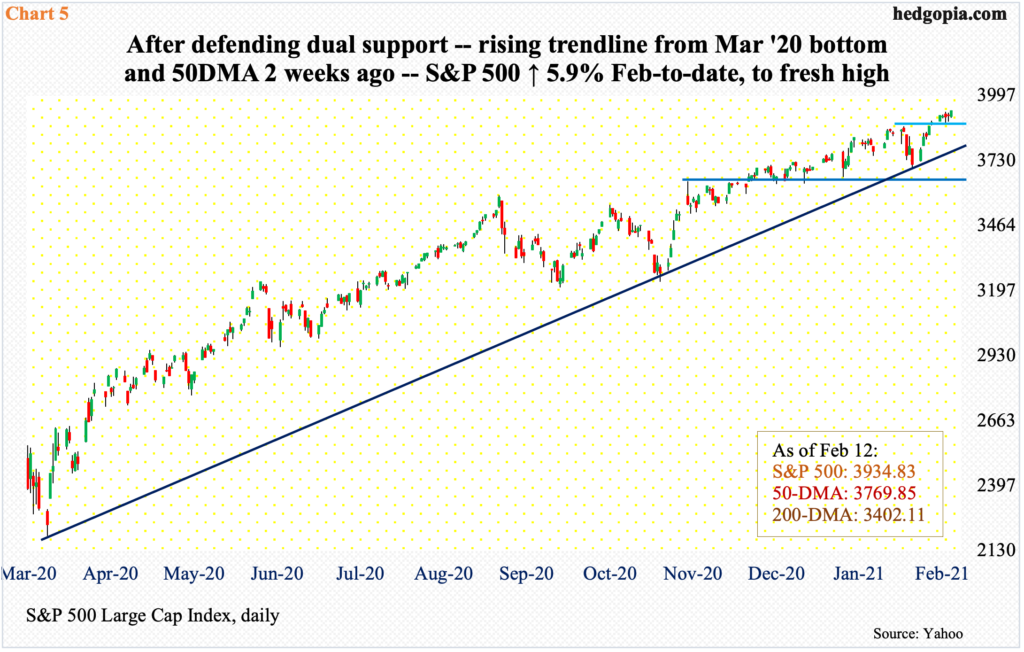
In the sessions ahead, from equity bulls’ perspective, the importance of 3870s on the S&P 500 (SPX) is no less than VIX heading toward mid- to high-teens.
Since bottoming last March, the large cap index (3934.83) has broken one after another resistance, which then quickly turned into support. Near term, 3870s is a similar level. For upward momentum to persist higher, this needs to generate buying interest.
Having just defended a rising trend line from last March, bulls are feeling pretty good. Two weeks ago, as January unwound, the S&P 500 landed right on that trend line (Chart 5), which at the time also lined up with the 50-day moving average. It was defended with vigor. With two weeks in, February is up 5.9 percent.
Optimism has continued to pay off.
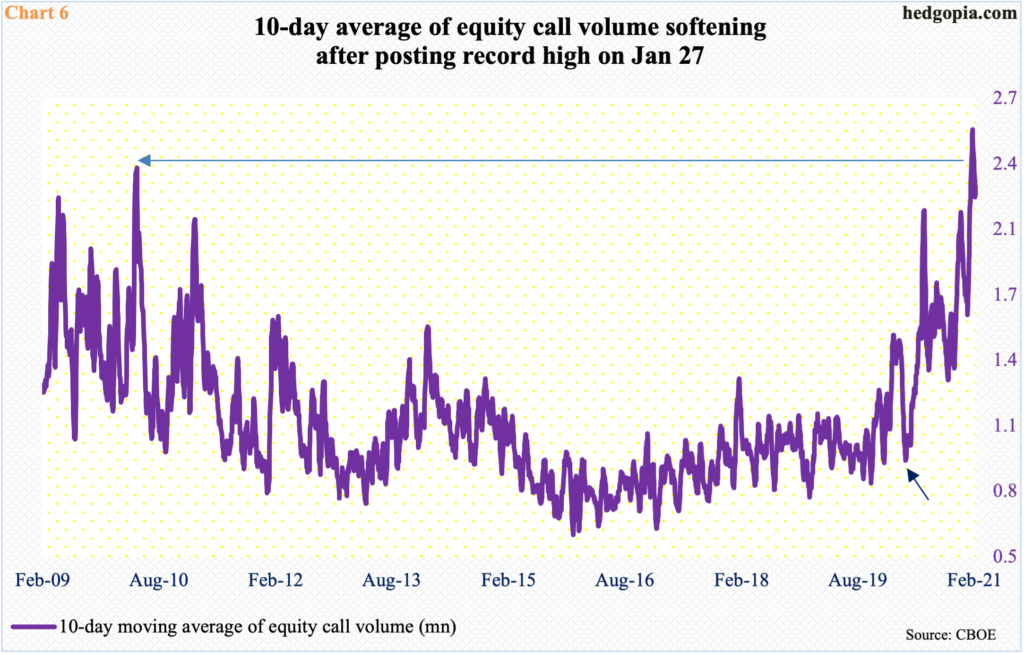
Of note, investors have been aggressively using calls to bet on the direction of the market since last March (arrow in Chart 6). This was when the S&P 500 tumbled 35 percent over five weeks. The bottom was put in on March 23 (Chart 5), which incidentally coincided with the Fed announcing unlimited quantitative easing. Early March last year, the Fed held $4.2 trillion in assets, which have now ballooned to $7.4 trillion.
The so-called Fed put has lit a fire under investor risk-on attitude. On January 28, the 10-day average of equity call volume hit 2.54 million – an all-time high, surpassing the prior high of 2.35 million from April 2010. The enthusiasm has softened a tad, with last Friday at 2.26 million, but remains highly elevated.
The thing is, these call buyers have been on the right side of the trade and minting money. More often than not, this tends to be a self-fulfilling prophecy – until a time when momentum breaks and goes the other way. When that happens, only the nimble ones will survive.
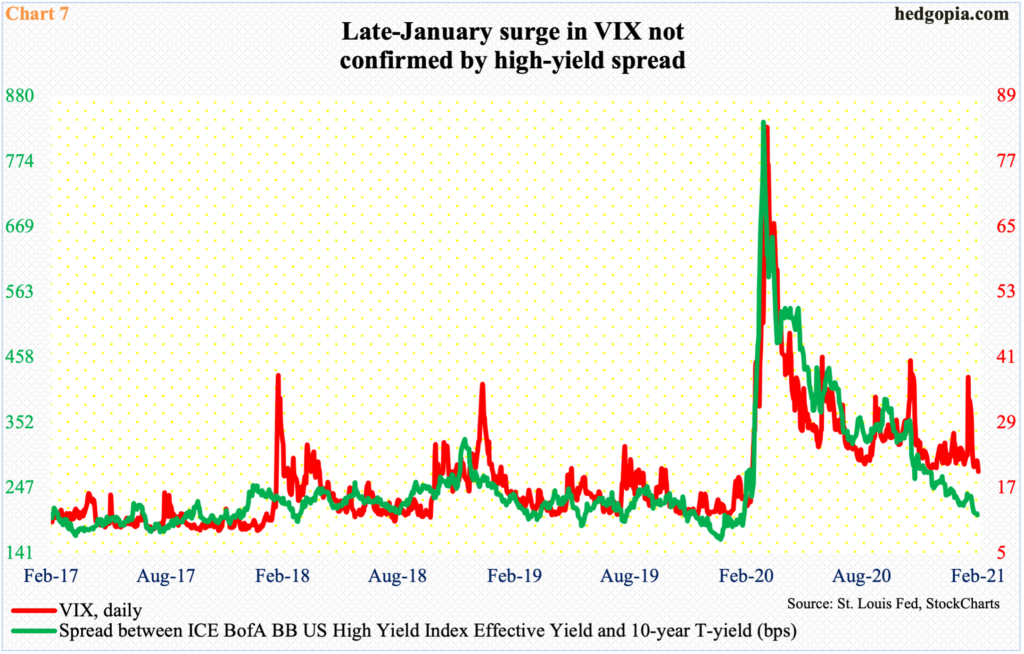
There is nothing natural about how one after another asset is trading currently. BB high-yield bonds are yielding 3.2 percent – a new low – down from just under nine percent last March. By the way, the Fed announced in that month that it would begin buying investment-grade corporate bonds, which was expanded to also include junk bonds in April. Investors have taken this as a cue to load up on these risky assets.
Consequently, the spread between high-yield and the 10-year treasury yield is only 200 basis points, approaching the suppressed levels lasting years, before exploding last February-March (Chart 7). Incidentally, January’s jump in VIX was not confirmed by the spread, which was acting much more sanguine.
Amidst all this, there is also a lesson in all this. Chart 2 teaches us that VIX only peaks after non-commercials either go long or come close (arrows). The contango seen in Chart 3 eventually makes way for backwardation. In Chart 4, VIX:VXV goes back and forth between oversold and overbought territory – the same way the spread in Chart 7 switches between greed and fear.
The current greed phase will end, too. It is just a question of if there is still some juice left for equity bulls to squeeze out of volatility. As things stand, there is a decent chance of that happening if VIX heads toward mid- to high-teens. This will then make way for a reversal trade.
Thanks for reading!


