
Potential Rising Wedge (Charts)
The S&P 500 Index continued higher last week, despite disappointing crude oil prices and initial unemployment claims indicating tough economic conditions will continue, although plans for reopening the U.S. economy seemed to offset some of the negative news. The Market Review includes a chart showing a potential classical Rising Wedge pattern along with updating the Elliott Wave counts.

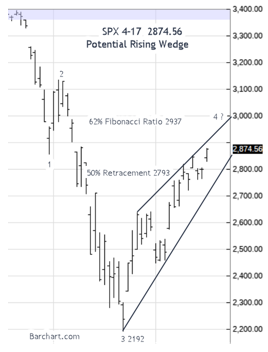
After bottoming at 2192 on March 23, creating an impulse 3-wave, it quickly rebounded, formed a potential small Rising Wedge, and then continued above the 50% retracement at 2793 shown in the chart above. The Fibonacci 62% ratio at 2937 becomes the next target for a potential 4- wave retracement label.
"...Rising Wedge is a quite characteristic pattern for Bear Market rallies." The difference between a Rising Wedge and what might be called a normal up trend channel is that the Rising Wedge sets a sort of limit on the advance. Its converging boundary lines focus on the point where the advance will halt and reaction set in." – Edwards and Magee, Technical Analysis of Stock Trends, 5th edition.
However, when compared to the previous major decline that ended on December 26, 2018, one that also formed a potential Rising Wedge from the 3-wave impulse low, shown in Digest Issue Volume 19 Number 3 "New Rising Wedge, " it broke the lower boundary, traded sideways for 5 days along the 50-day MA, then continued higher, never forming an anticipated 4-wave top. Based on this limited, but likely comparable sample, it seems Algos aren't paying much attention to classical chart patterns, Elliott Waves or Fibonacci retracement ratios, that were all equally useless in this case, as the new uptrend from the December 26 low, continued.
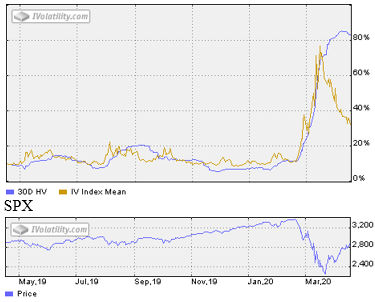
CBOE Volatility Index® (VIX) 38.15 declined 3.52 points or -8.45% last week. Our similar IVolatility Implied Volatility Index Mean, IVXM using four at-the-money options for each expiration period along with our proprietary technique that includes the delta and vega of each option, declined -4.31 points or -11.67% ending at 32.63. The spike up to 77.15% on Monday March 16, the day SPX declined 324.89 points, will likely mark the top for this market decline, as regression to the mean, like slowly letting air out of a balloon, seems well underway.
VIX Futures Premium
This next chart shows as our calculation of Larry McMillan’s day-weighted average between the first and second month futures contracts as of last Friday.
With 22 trading days until May expiration, the day-weighted premium between May and June allocated 88% to May and 12% to June for a premium of -9.25%, still in the red bear zone with the entire curve below both VIX and 9-day short-term VIX.
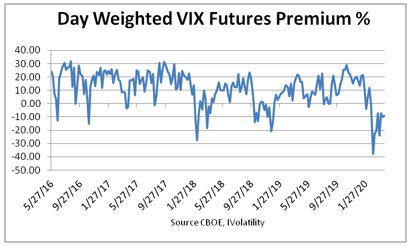
The premium measures the amount that futures currently trade above or below the cash VIX, (contango or backwardation) until front month futures contract converges with the VIX at the next monthly futures expiration on Wednesday May 20. The position of the futures curve relative to the VIX, as measured by the premium, makes a good sentiment indicator.
Strategy
Until SPX implied volatility returns to around 20%, option selling strategies remain favorable; especially those with limited and defined risk such as Iron Condors and Short Put Spreads as well as short puts on stocks with the intention of being assigned.
As for long stock or ETF positions, consider closing collars and put spread hedges since SPX continued above the 50% retracement level at 2793.
However, until the Potential Rising Wedge shown above is resolved, maintaining SPY out-of-the-money put spreads will provide some insurance with defined and limited cost as it continues toward the 62% Fibonacci ratio at 2937 before completing a possible Elliott 4-wave. Should it then fail and turn lower it could begin a long slow decline to an ultimate 5-wave at, near or below the March 23 low at 2192.
The bulls say when SPX retraces 50% of its initial momentum decline, history shows it doesn't retest the low, citing the December 2018 decline. In addition, positive momentum, declining options implied volatility, improving VIX futures premium, improving market breadth measured by our preferred McClellan Summation Indicator all suggest a declining probability for a retest of the March 23 low at 2192.
Summary
The S&P 500 Index continued above the 50% retracement level consistent with an Elliott 4-wave and may continue even higher enough challenge the 62% Fibonacci ratio and beyond. However, since a sudden decline that would activate a potential Rising Wedge would change the picture and increase the likelihood of retesting the March 23 low. For now, the bulls have the upper hand so the odds favor a continuation of the uptrend.
Disclaimer: IVolatility.com is not a registered investment adviser and does not offer personalized advice specific to the needs and risk profiles of its readers.Nothing contained in this letter ...
more

