
Post-Russell 2000 Breakout, NFIB Survey Shows Big Improvement In Small-Business Profit Trend
Two weeks after the Russell 2000 breaks out, November’s data shows a big improvement in small-business profit trend. Job openings is another data point worth watching. Small-business openings currently are diverging with the national trend.
The recent breakout in small-caps is creating a lot of buzz.
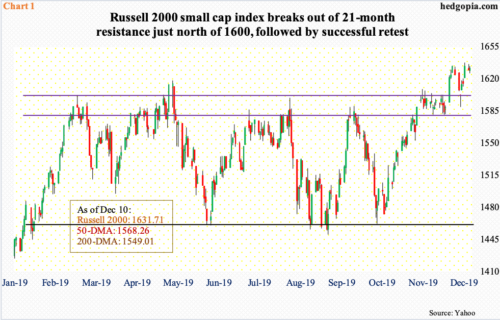
The Russell 2000 small-cap index broke out of 1600-plus 11 sessions ago, which was quickly followed by a successful retest (Chart 1). Barron’s this week even ran a cover story highlighting this, although this shows the idea is now getting popular.
The breakout came after a long range-bound action. If genuine, breakout traders could be eyeing to test the all-time high of 1742.09 from August last year when the index (1631.71) peaked.
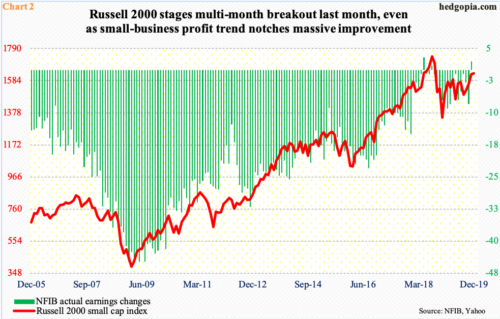
Interestingly, the Russell breakout late November came in the midst of a profit picture that was not headed in the right direction.
The NFIB (National Federation of Independent Business) ‘actual earnings changes’ sub-index dropped to minus eight in October. Then came November’s data on Tuesday. Turns out small-business profit trend improved in that month – big time, with the sub-index rising 10 points month-over-month to plus two.
In general, the two variables in Chart 2 tend to move together.
The overall index rose 2.3 points m/m in November to 104.7. Optimism reached the highest ever 108.8 in August last year. To reiterate, the Russell 2000 peaked in that month. Importantly, the NFIB optimism index has remained north of 100 for 36 straight months (not shown here).
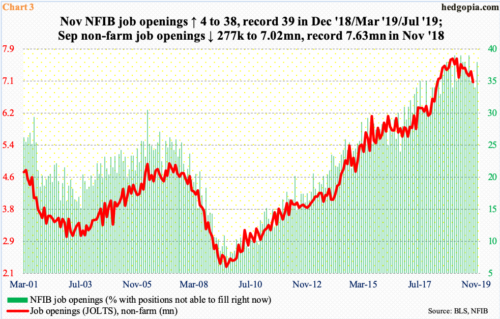
Another component that rose nicely in November was job openings, up four points m/m to 38. The all-time high of 39 was hit three times in the last 12 months – December 2018, March 2019 and July 2019 (Chart 3). Using this metric, job openings are holding up, although the small-business trend is in slight divergence with the national trend.
Non-farm job openings (JOLTS) are published with a little lag. October’s data come out next week. In September, openings fell 277,000 m/m to 7.02 million. The all-time high of 7.63 million was hit in November last year. The red line in the chart needs to begin to firm up, otherwise, the strength in small-business openings will not be confirmed. Historically, the two tend to move together.
Longer-term, this will impact how small-caps perform. The recent breakout is pricing in rosier times.


