
Positioning For A Strong 2021 And Better Times Ahead
By some measures, the month of November was the best month for global stock markets in over 20 years, and the rally has carried on into December. Here in the US, the S&P 500 (SPY) gained +12.2% since the end of October through Friday’s close, while the SPDR S&P 400 MidCap (MDY) rose +18.1% and the SPDR S&P 600 SmallCap (SLY) +24.3%. In fact, November was the biggest month ever for small caps. Notably, the Dow broke through the magic 30,000 level with conviction and is now testing it as support. But more importantly in my view, we have seen a significant and sustained risk-on market rotation in what some have termed the “reopening trade,” led by small caps, the value factor, and cyclical sectors. Moreover, equal-weight indexes have outperformed over the same timeframe (10/30/20-12/11/20), illustrating improving market breadth. For example, the Invesco S&P 500 Equal Weight (RSP) was up +16.9% and the Invesco S&P 600 SmallCap Equal Weight (EWSC) an impressive +29.5%.
As the populace says good riddance to 2020, it is evident that emergency approval of COVID-19 vaccines (which were developed incredibly fast through Operation Warp Speed) and an end to a rancorous election cycle that seems to have resulted in a divided federal government (i.e., gridlocked, which markets historically seem to like) has goosed optimism about the economy and reignited “animal spirits” – as has President-elect Biden’s plan to nominate the ultra-dovish former Federal Reserve Chairperson Janet Yellen for Treasury Secretary. Interestingly, according to the WSJ, the combination of a Democratic president, Republican Senate, and Democratic House has not occurred since 1886 (we will know if it sticks after the Georgia runoff). Nevertheless, if anyone thinks our government might soon come to its collective senses regarding the short-term benefits but long-term damage of ZIRP, QE, and Modern Monetary Theory, they should think again. The only glitch right now is the impasse in Congress about the details inside the next stimulus package. And there is one more significant boost that investors expect from Biden, and that is a reduction in the tariffs and trade conflict with China that wreaked so much havoc on investor sentiment towards small caps, value, and cyclicals. I talk more about that below.
Going forward, absent another exogenous shock, I think the reopening trade is sustainable and the historic imbalances in Value/Growth and Small/Large performance ratios will continue to gradually revert and market leadership broadens, which is good for the long-term health of the market. The reined-in economy with its pent-up demand is ready to bust the gates, bolstered by virtually unlimited global liquidity and massive pro-cyclical fiscal and monetary stimulus here at home (with no end in sight), as well as low-interest rates (aided by the Fed’s de facto yield curve control), low tax rates, rising inflation (but likely below central bank targets), and the innovation, disruption, and productivity gains of rapidly advancing technologies. And although the major cap-weighted indexes (led by mega-cap Tech names) have already largely priced this in, there is reason to believe that earnings estimates are on the low side for 2021 and stocks have more room to run to the upside. Moreover, I expect active selection, strategic beta ETFs, and equal weighting will outperform.
On that note, Sabrient has been pitching to some prominent ETF issuers a variety of rules-based, strategic-beta indexes based on various combinations of our seven core quantitative models, along with compelling backtest simulations. If you would like more information, please feel free to send me an email.
As a reminder, we enhanced our growth-at-a-reasonable-price (aka GARP) quantitative model just about 12 months ago (starting with the December 2019 Baker’s Dozen), and so our newer Baker’s Dozen portfolios reflect a better balance between secular and cyclical growth and across large/mid/small market caps, with markedly improved performance relative to the benchmark S&P 500, even with this year’s continued market bifurcation between Growth/Value factors and Large/Small caps. But at the same time, they are also positioned for increased market breadth as well as an ongoing rotation to value, cyclicals, and small caps. So, in my humble opinion, this provides solid justification for an investor to take a fresh look at Sabrient’s portfolios today.
In this periodic update, I provide a comprehensive market commentary, offer my technical analysis of the S&P 500 chart, review Sabrient’s latest fundamentals-based SectorCast quant rankings of the ten US business sectors, and serve up some actionable ETF trading ideas. To summarize, our outlook is bullish (although not without bouts of volatility), the sector rankings reflect a moderately bullish bias (as the corporate outlook is gaining visibility), the technical picture looks solid, and our sector rotation model is in a bullish posture. In other words, we believe “the stars are aligned” for additional upside in the US stock market – as well as in emerging markets and alternatives (including hard assets, gold, and cryptocurrencies).
Commentary:
Given their greater access to capital and wider business “moats,” most large companies have survived (and often thrived) in this tumultuous year – with the notable exceptions of the Energy sector and some Consumer Services industries (primarily related to travel, dining, and entertainment). But more recently, Energy has been showing leadership. In fact, for November, Energy was the clear leader (+28%), and remarkably, since its intraday low on 10/29/20 through Friday 12/11/10 (just six short weeks), the Energy Select Sector SPDR (XLE) is up a whopping +52%. According to S&P Dow Jones Indices, the best performing factor strategies in November were High Beta and Enhanced Value, while Growth and Momentum underperformed. Also, equal-weight indexes have been outperforming their market-cap-weighted brethren.
Although small businesses generally took it on the chin due to the shutdowns, the iShares Russell 2000 (IWM) has been rapidly gaining traction and has now surpassed the YTD performance of the SPDR S&P 500 (SPY), +16.1% versus +15.4%. This is all quite healthy behavior. Moreover, ETFGI reported that assets invested in ETFs and ETPs listed globally reached a record $7.62 trillion, and net inflows hit a record $670.57 billion at the end of November.
Despite its impressive gain over the past six weeks, Energy is still the worst-performing sector YTD, while the top performer is still Information Technology, buoyed by a combination of unstoppable secular growth trends and solutions to pandemic-driven disruption. Recall that during the dawning of the Internet age in the mid-1990s coupled with the runup to Y2K (and fear of widespread computer failure from the 2-digit date turning over zeros), the economy saw a massive capital upgrade cycle in a short amount of time that pushed many technology companies to dizzying heights. Of course, despite the Internet Bubble bursting many marginal companies out of existence, consumers and businesses embraced the Internet and other disruptive technologies – and never looked back. Similarly, today we have seen another “step-function” technological transformation in the economy, this time thanks to the pandemic hurrying the adoption of digitization and tools for remote working, learning, shopping, touchless transactions, gaming & entertainment, disease testing, and precision medicine. Witness the incredible price moves in firms like Zoom Video (ZM), Square (SQ), MercadoLibre (MELI), Pinterest (PINS), NVIDIA (NVDA), DocuSign (DOCU), The Trade Desk (TTD), Beam Therapeutics (BEAM), Quidel (QDEL), and Moderna (MRNA), just to name a few.
I mentioned at the top that stocks have been reacting at least partly to an expectation that a Biden Administration will likely try to “normalize” relations with China by reducing or removing tariffs and other trade barriers. Although I support President Trump’s goals in confronting China and its unapologetic flouting of WTO trade rules and IP protections (after all, someone had to do it eventually, and Trump had the right personality for the job), there is little doubt that, while good for the US dollar (as a global safe haven), it severely impacted corporate visibility, supply chains, investor psyche, and indeed most value- and cyclicals-oriented portfolios like Sabrient’s.
Value/Growth divergence update:
If we look back over the past couple of years since mid-2018 when the trade war escalated, the market’s strength has been somewhat deceiving in that the growth-oriented, cap-weighted indexes have been in a strong bull market thanks primarily to a handful of mega-cap Technology names, while most of the rest of the broader market essentially has been in a downtrend, making it difficult for valuation-oriented portfolios or equal-weight indexes to keep up. To illustrate, below is a 5-year chart (starting 7/1/15) comparing the S&P 500 LargeCap Pure Growth ETF (RPG) and the S&P 600 SmallCap Pure Value ETF (RZV). This chart illustrates the stark market bifurcation and relative performance gaps between large vs. small, growth vs. value, and secular-growth vs. cyclical-growth. (Note: Highly cyclical and value-oriented sectors would include Financials, Industrials, Materials, and Energy.)
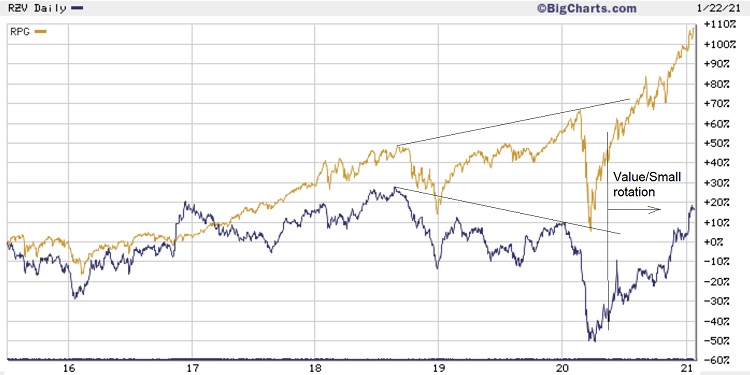
You can see that after the 2016 election, market breadth and the value factor got a strong but short-lived boost during the “Trump Bump,” and then in mid-2018 the trade war with China launched a stark and historic market bifurcation due more to uncertainty rather than a significant cut to earnings expectations. And the bifurcation has only gotten worse this year due to COVID-19, lockdowns, civil unrest, and a tumultuous election. I have highlighted this dynamic on the chart with the trendlines tracing the higher-highs uptrend in RPG versus the lower-highs downtrend in RZV since mid-2018. The major market-cap-weighted indexes continued to hit new highs, primarily on the backs of the five mega-cap secular-growth Tech stocks – namely Apple (AAPL), Amazon (AMZN), Microsoft (MSFT), Alphabet (GOOGL), Facebook (FB), aka “FAAAM” – while a large swath of the market has been quite weak. As a result, for the past 2-1/2 years, valuation-oriented portfolios like Sabrient’s underperformed, as did many broad-market equal-weighted indexes.
However, I also show on the 5-year chart where, since mid-May of this year (and especially during a record-breaking November), there has been improving market breadth and a rotation into value, cyclicals, and smaller caps, which is a bullish sign of a healthy market. To illustrate, the chart below zooms in on the past 7 months' comparative performance of those same two ETFs (RZV and RPG), which shows much different relative performance. Since 5/15/20, SmallCap Pure Value has greatly outperformed LargeCap Pure Growth. I think that a new expansionary economic phase is about to launch, and will be fueled by a vaccine rollout, reopening of the economy, unleashing of pent-up demand, an infrastructure spending bill, and higher inflation.

Indeed, institutional buyers are back, encouraged by solid Q3 earnings reports, and they are buying the higher-quality stocks (not just the high-flying momentum stocks). The 5-year TIPS breakeven inflation is once again on the rise, now at 1.83%, which is above pre-pandemic levels. Likewise, a 10-year Treasury yield that has been gradually rising for the past four months (from about 0.50% in August to around 0.90% today) implies increasing confidence in economic recovery and rotation from bonds to stocks. Indeed, history suggests the next leg up for stocks will prod Treasury yields to break out to the upside. Furthermore, as credit markets continue to rally with an ongoing US economic recovery, smaller companies should enjoy better business and credit conditions, facilitating a continued mean reversion for small caps. Industrials, Energy, and small caps typically have greater earnings leverage than large-cap Technology, which provides an advantage during an expansionary economic phase. I particularly like the Industrial sector and small caps.
Notably, the Financial sector (primarily regional banks) has long carried the largest weight in the Russell 2000 small-cap benchmark, although Healthcare has taken the mantle this year. By the way, small-cap Tech has been greatly underperforming large-cap Tech (which of course is dominated by the mega-cap dominators) in both price returns and earnings growth essentially since 2014, so perhaps a continuation of this nascent value/cyclical recovery will finally allow the smaller players to play some catch-up.
Going forward, I expect the extreme Value/Growth and Small/Large relative performance divergences will continue to converge and market leadership will broaden, which should be favorable for value, quality, and GARP strategies like Sabrient’s (which were greatly impacted by the trade war), although not to the exclusion of the unstoppable secular-growth industries. In other words, investors should be positioned for both cyclical and secular growth. So, we enhanced our underlying quant model to make it more “all-weather” by developing a proprietary Growth Quality Rank (GQR) and adding it as an alpha factor to give stronger weight to consistency and reliability of earnings growth and thus allow secular-growth stocks to score in our rankings more competitively with cyclical growth, even with less attractive forward valuations. As a result, our newer Baker’s Dozen portfolios launched since December of last year reflect a better balance between secular and cyclical growth and across market caps. Several Tech names became eligible for consideration (and they have been our top performers), and yet our portfolios also remain well-positioned for a continued market broadening and rotation into value, cyclicals, and small caps.
Similarly, BlackRock recently upgraded US equities to overweight, recommending a “barbell” strategy comprising: 1) quality large-cap stocks “riding structural growth trends,” and 2) small-mid caps “geared to a potential cyclical upswing.” Of course, my regular readers know that this is exactly what I have been suggesting in my posts – and what Sabrient has been doing all year in constructing our various portfolios, i.e., a balance between secular and cyclical growers and across market caps.
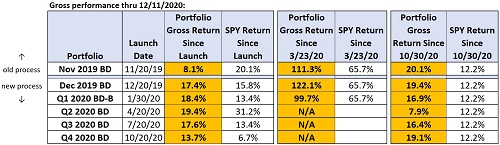
To illustrate the improvement in relative performance, the table below shows the performance of the live Baker’s Dozen portfolios from their launch dates through current (12/11/20), as well as since the selloff bottom on 3/23/20 (if it was live at that time) and during the past 6 weeks of risk-on rotation, relative to the benchmark SPY.
GDP, global debt, and interest rates:
The BEA’s second estimate of Q3 2020 real GDP growth came in at an annualized +33.1%, which matched the preliminary estimate and remains the largest ever quarterly GDP growth rate. Of course, the consumer spending that supported this surge was largely the result of the trillions in the fiscal and monetary stimulus (aka, the dollar printing press) rather than organic economic activity. M2 money supply indicates 24% more dollars in circulation today than a year ago. Nevertheless, it helped many at-risk businesses survive. Looking ahead, the Atlanta Fed’s GDPNow initial estimate for real GDP growth (seasonally adjusted annual rate) for Q4 2020 is +11.2%, which is much higher than its initial estimate of +2.2% from several weeks ago. On the other hand, the New York Fed’s Nowcast estimate stands at just +2.5% for Q4 2020 and +5.9% for Q1 2021. Evidently, there remains quite a bit of uncertainty and disagreement in the models. No doubt, the economic recovery has been more “K-shaped” than V-shaped in that segments of the economy has been strong (e.g., technology, WFH, online shopping, home building, home improvement) while other segments either have struggled or have been in an outright depression (e.g., oil & gas, commercial real estate, financials, travel & leisure, dining).
Of course, global debt is a big and growing concern. Here are some startling numbers I dug up. According to the Institute for International Finance (IIF), total global debt is expected to hit $277 trillion by the end of the year, which is 365% of global GDP. Of course, GDP has been artificially boosted by money printing, so organic GDP is a good bit lower (and so the debt ratio is even higher). Among the developed markets (aka advanced economies), total debt is around 430% of global GDP, and for emerging markets, it is around 250%. This year alone, as of the end of September, the world added $15 trillion of debt, about half of which is government borrowing. The US, with our apparent embrace of Modern Monetary Theory (MMT) and unlimited money printing, now has federal debt of about $27 trillion, which is $218,450 per taxpayer and 143% of domestic GDP, and our federal budget deficit seems headed to hit $2 trillion deficit in fiscal year 2021.
The IIF estimates the world could reach $360 trillion in total debt by 2030. And here in the US, the Congressional Budget Office says we are headed for a $100 trillion total debt by 2050. The IIF commented that “There is significant uncertainty about how the global economy can deleverage in the future without significant adverse implications for economic activity.” Moreover, none of these debt numbers includes other government liabilities, such as state and municipal pension commitments, which likely will require federal bailouts to fulfill. Of course, this is all quite ominous in the longer term – but unlikely to impact stocks over the next few years.
Interest rates remain historically low, which makes servicing the debt more manageable. The 30-year Treasury yield closed Friday 12/11/20 at 1.63%, while the 10-year T-note is at 0.90%, the 2-year T-note 0.11%, and the 3-month T-bill 0.08%. So, the 3-month/10-year spread has steepened to +82 bps and the 2-10 spread is +79 bps. A rising 10-year Treasury yield implies increasing confidence in economic recovery. Overseas, many countries are still issuing debt with a negative nominal yield, with over $17 trillion of government debt trading at a negative yield. Moreover, most government debt today (including in the US) trades at a negative real yield (after accounting for inflation).
The next FOMC meeting is this week, but it has become a less momentous event given that the Fed has committed to keeping interest rates low through at least 2023. Goldman Sachs predicts the Federal Reserve will not raise interest rates again until 2025, which they say “encourages economic activity by keeping borrowing costs low, but heightens the systemic risks associated with massive personal, corporate and government debt loads.” However, DataTrek observed that although the ratio of corporate debt to GDP is historically high, “aggregate corporate debt to equity market cap is actually very low just now (33% today vs. 68% in 2009),” which means companies can reduce debt simply by issuing stock, especially given an abundance of cheap liquidity and favorable supply/demand dynamics (i.e., the mismatch between high demand and a limited supply of shares).
Both investment grade and high yield bond spreads continue to tighten, with both now at or below their pre-pandemic levels (and continuing to fall). With A-rated or higher 10-year debt available at 1.5% interest, it is almost “free money” for funding expansion, capital upgrades, M&A, or stock buybacks. And the Fed’s financing cost for its $7 trillion balance sheet (mostly under 5 years maturity) is less than 37 bps/year.
Earnings, valuations, gold, and bitcoin:
As for corporate earnings in the US, after a stellar Q3 earnings season, expectations for Q4 continue to rise. And that’s critical because, as DataTrek observed, “…2021 will live or die by earnings growth alone. Interest rates...won’t help now.” FactSet’s consensus estimate for 2021 is now nearly $170/share, which puts the forward P/E multiple on S&P 500 earnings for 2021 at 21.5x. My view is that rather than another correction to bring valuations down further, more likely there will be continued rotation from the liquidity-driven investing of the past several years to earnings-driven investing, which would favor cyclical/value-oriented sectors (e.g., Industrial, Financial, Materials, Energy), and commodity-oriented industries, supported by a weaker dollar. Notably, Wall Street has been raising estimates for these beaten-down industries with the greatest earnings leverage. Furthermore, DataTrek has observed that Wall Street tends to underestimate the improvement in corporate profits after a recession. So, if you overlay the sell-side’s same 9% underestimation for 2010 after the Financial Crisis, 2021 S&P earnings could come in closer to $185/share, which implies a current forward P/E of 19.8x. This leaves further room to the upside, in my view.
On the other hand, looking at all timeframes, there is a historical average overestimation of 7.0%, which would indicate a final value for 2021 of $158, which would imply a forward P/E of 23.2x, which is not as favorable. However, when comparing valuations today against historical numbers, I think it is important to keep in mind the radical transformation of both our economy and stock market. With regard to Value Investing and P/B (price to book value), a company's book value is far less dependent on tangible assets like PP&E (property, plant, and equipment) and much more tied to its intangible assets like goodwill, brand recognition, and intellectual property (IP). And with regard to growth investing and P/E, earnings in the companies that dominate the major market indexes are much more consistent and reliable, and less volatile compared with cyclicals and the big industrial and energy conglomerates that used to dominate the major indexes. By the way, it used to be that semiconductor companies were considered a cyclical part of the Tech sector, but given their important status today as the foundation of so many of today’s secular-growth technologies, the industry is not quite so cyclical anymore, so they can command higher valuations.
M&A, VC funding, IPOs, and SPACs (special purpose acquisition companies) have been quite active this year, which continues to reflect both optimism for the economy and stocks and easy access to capital – although some might call it misallocation of capital or “malinvestment” due to artificially low-interest rates and an unsustainable boost in money supply. The latest announcements have been among the largest, including S&P Global (SPGI) acquiring IHS Markit (INFO), where my daughter works, for $44 billion, which merges two of Wall Street’s data juggernauts. Also, AstraZeneca (AZN) just announced that it will buy Alexion (ALXN) for $39 billion. Venture capital funding in the biotech space has hit a record high of $35 billion so far this year, and biotech IPOs have gathered $23 billion for drug development. In addition, 230 SPACs (and their “blank check” structure in search of a reverse merger) have launched this year alone, which is equivalent to about half of the number of IPOs. The latest example is Airbnb (ABNB), which just started public trading last Thursday at a $100 billion valuation. Sure, the firm is an innovator and disruptor, and it was able to pivot in a difficult year for travel to actually achieve profitability in the most recent quarter, but is it really worth $100 billion? Time will tell. Regardless, I doubt any of the pre-IPO investors are complaining. The last private funding round in April valued it at $18 billion, so those investors got a 5x bump in just eight months.
Final comments:
All told, the outlook for the economy and stocks continues to look bright, to wit:Economic reports and forward guidance continue to strengthen, bolstered by the vaccine rollout timetable.
- Q3 corporate earnings have been much better than expected, with accelerated upside forecasted.
- The Fed has committed to ultra-low interest rates for the foreseeable future, which makes equities attractive by comparison in at least three ways:
- discounting future earnings streams at a low discount rate means higher present value
- a lower cost of capital boosts EPS
- bonds as an alternative to stocks have less upside for capital appreciation and lower current yields for income, i.e., TINA (there is no alternative).
- Massive fiscal and monetary stimulus should continue to grow as the government seems determined to continue to borrow and spend at an unprecedented rate. This also makes a falling dollar and rising inflation more likely.
- Typically, Americans keep 7% to 8% of their income in savings, but this year it surged to 33% due to the pandemic. So, there is a lot of investable cash (estimated at nearly $5 trillion) on the sidelines.
- This country’s unflagging entrepreneurial spirit keeps bringing innovation and disruption with rapidly advancing technologies.
Unleashing the pent-up demand and abundant cash on the sidelines should make both the economy and stock market soar. In fact, I think small-cap stocks are in the early stages of a multiyear bull market – and small caps by nature of their huge upside provide investors with greater opportunities for life-changing returns. Emerging markets look good, too. A recent Bank of America survey of fund managers found that over half chose emerging markets as their favorite asset class for 2021. JP Morgan Chase opined that emerging market equities, debt, and forex all are poised to benefit the most from a cyclical recovery in the global economy. FactSet reports that the consensus of top-down market strategists and the consensus of bottom-up analysts both expect the S&P 500 to exceed 4,000 by the end of 2021. With rising earnings, continued rotation into some of the neglected market segments, plus some additional multiple expansion as visibility becomes clearer, I think it could go even higher – and good stock picking can perform even better.
Thus, it seems that the stock market remains the place to be invested. A reined-in economy is spilling over and ready to burst the dam that has been the COVID lockdown (and associated worsening of wealth inequality). The U.S. economy is highly resilient and tends to bounce back quickly. In this case, its recovery is facilitated by Operation Warp Speed and the arrival of a highly effective vaccine. But given the uncertainties around the potential for rising inflation and devaluing of major market currencies (including the US dollar), I also hold a significant portion of my personal portfolio in alternatives like gold, gold miners, silver, and cryptocurrencies (including bitcoin, ether, and other altcoins) – in fact, these might be some of the only uncorrelated diversifiers for a stock portfolio. SSGA believes gold’s historically low correlation with many traditional asset classes makes it preferable to bonds today for improving strategic allocations.
Some experts see drivers of gold price including rising physical demand in China and India, as well as the preponderance ($17 trillion) of negative-yielding bonds around the world. And regarding crypto, rather than being driven by retail speculators as in the past, this year it has seen rapid capital inflows primarily due to: 1) uncapped government money-printing deficit spending, 2) institutional adoption, and 3) 5G connectivity that makes blockchain-verified transactions occur much faster. Note that Guggenheim, in its $5.3 billion Macro Opportunities Fund, has filed to invest up to 10% of its net asset value in Grayscale Bitcoin Trust (GBTC), which trades just like a stock or ETF through most brokers.
Of course, wealth inequality has worsened for a variety of reasons (including the rich having greater access to the abundant global liquidity), but wealth inequality in and of itself isn’t necessarily a bad thing, as long as the lower-income tiers of society are seeing real and sustainable improvement in their lives and incomes – and that was indeed happening under the Trump administration before the COVID lockdowns. But the lockdowns have created a huge setback for way too many people, as global poverty has doubled in just a handful of months, which means we cannot continue with or return to widespread lockdowns under any circumstance, in my view.
Please indulge me a final comment on the election. As I opined in my post last month, I believe that stocks were poised to rise post-election, no matter the outcome – as long as there is an outcome, rather than a draw-on court process. No doubt, we must hold an in-depth investigation into the lax procedures around verifying and counting the enormous number of mail-in ballots that undeniably overwhelmed a system ill-prepared to handle them in such quantities while protecting the integrity of the election – not so much to overturn the current election but to restore voter confidence in the system and to avoid this type of circus in future elections. There is no doubt in my mind that implementing “emergency measures” due to the pandemic, although intended to reduce “voter suppression,” actually allowed and in fact facilitated the widespread distribution of mail-in ballots to far too many people who never requested one (as opposed to the legitimate process of applying for an absentee ballot). By making the casting of fraudulent votes so much easier, the value of each legitimate vote was quite likely diminished. I’m not yet convinced that we can assert the election was sufficiently “rigged” so as to alter the outcome, but normal standards for election protocols certainly were compromised. So, an honest and rigorous investigation needs to take place before the next mid-term election. In the future, my hope is that blockchain technology can help eliminate voter fraud, given its great promise in data storage and record-keeping.
SPY Chart Review:
The SPDR S&P500 Trust (SPY) closed out Friday at 366.30 after a historic November and a healthy risk-on rotation into the lagging value and cyclical sectors with improving market breadth. In my post at the start of November (following a dismal second half of October), I said that the technical picture appeared “primed for at least a solid bounce,” and that’s indeed what we got. Notably, the iShares Russell 2000 small caps (IWM) and the iShares Transportation Average (IYT) both continue to build upon powerful upside breakouts to new all-time highs, which bodes well for the broad market. Emerging markets might be next to break out.
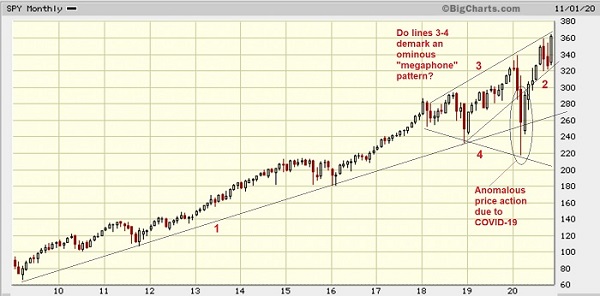
The long-term chart below shows monthly candlesticks for the SPY since the end of the Financial Crisis in early 2009. Some experienced chartists believe that the past three years have been forming a “megaphone top” as shown, characterized by both higher highs and higher lows (Lines 3 and 4), which would imply that price is destined to retest the falling line at the bottom of the megaphone (Line 4). But I don’t agree. Instead, I see a rising uptrend line (Line 1) transitioning into a steeper uptrend line (Line 2), and I think the COVID-driven selloff was just an anomaly that only briefly violated the long-term uptrend line (Line 1) around 250 in an abundance of investor caution, but quickly recovered. To me, price is not destined to retest Line 4 unless the virus mutates or otherwise overcomes the vaccine to wreak havoc on lives and the economy once again.
Latest Sector Rankings:
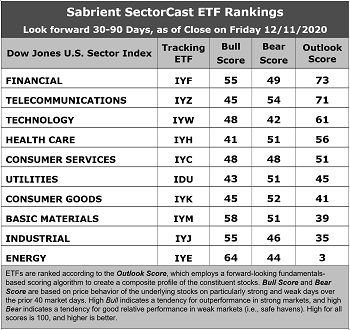
Relative sector rankings are based on our proprietary SectorCast model, which builds a composite profile of each of nearly 500 equity ETFs based on bottom-up aggregate scoring of the constituent stocks. The Outlook Score employs a forward-looking, fundamentals-based multifactor algorithm considering forward valuation, historical and projected earnings growth, the dynamics of Wall Street analysts’ consensus earnings estimates and recent revisions (up or down), quality, and sustainability of reported earnings, and various return ratios. It helps us predict relative performance over the next 2-6 months.
In addition, SectorCast computes a Bull Score and Bear Score for each ETF based on recent price behavior of the constituent stocks on, particularly strong and weak market days. A high Bull score indicates that stocks within the ETF recently have tended toward relative outperformance when the market is strong, while a high Bear score indicates that stocks within the ETF have tended to hold up relatively well (i.e., safe havens) when the market is weak.
Outlook score is forward-looking while Bull and Bear are backward-looking. As a group, these three scores can be helpful for positioning a portfolio for a given set of anticipated market conditions. Of course, each ETF holds a unique portfolio of stocks and position weights, so the sectors represented will score differently depending upon which set of ETFs is used. We use the iShares that represent the ten major U.S. business sectors: Financial (IYF), Technology (IYW), Industrial (IYJ), Healthcare (IYH), Consumer Goods (IYK), Consumer Services (IYC), Energy (IYE), Basic Materials (IYM), Telecommunications (IYZ), and Utilities (IDU). Whereas the Select Sector SPDRs only contain stocks from the S&P 500 large-cap index, I prefer the iShares for their larger universe and broader diversity.
Here are some of my observations on this week’s scores:
1. Financial remains in the top spot with an Outlook score of 73, which is somewhat low for the top scorer. The sector displays strong sell-side analyst sentiment (positive net revisions to EPS estimates), good return ratios, a reasonable forward P/E of 18.1x, an attractive forward PEG (forward P/E divided by projected EPS growth rate) of 1.96, and strong insider sentiment (open market buying). Telecom takes the second spot with an Outlook score of 71, given its low forward P/E of 13.4x and solid return ratios. Rounding out the top five are Technology, Healthcare, and Consumer Services. Notably, earnings estimates continue to be revised upwards across all sectors.
2. The bottom three sectors are Energy with an Outlook score of 3, Industrial at 35, and Basic Materials at 39. Energy has long been the cellar-dweller given its poor near-term growth prospects and high forward P/E and PEG ratios. Industrial and Materials have fallen primarily due to their strong price performance during the sustained value/cyclicals rotation.
3. Looking at the Bull scores, Technology has cooled off its torrid pace, so now Energy displays the top score of 64, followed by Basic Materials at 58 and Financial and Industrial tied at 55, as stocks within these sectors have displayed relative strength on strong market days. Utilities scores the lowest at 43. The top-bottom spread of 21 points reflects low sector correlations on strong market days. It is desirable in a healthy market to see low correlations reflected in a top-bottom spread of at least 20 points, which indicates that investors have clear preferences in the market segments and stocks they want to hold.
4. Looking at the Bear scores, defensive sector Telecom scores the highest at 54, followed by Consumer Goods (Staples/Noncyclical) at 52, as stocks within these sectors have been the preferred safe havens lately on weak market days. Technology displays the lowest score of 42, as investors have fled during recent market weakness. The top-bottom spread is only 12 points, which reflects high sector correlations on weak market days. Ideally, certain sectors will hold up relatively well while others are selling off (rather than broad risk-off behavior), so it is desirable in a healthy market to see low correlations reflected in a top-bottom spread of at least 20 points.
5. Financial displays the best all-around combination of Outlook/Bull/Bear scores, while Energy is by far the worst. Looking at just the Bull/Bear combination, Basic Materials and Energy are the best, followed by Financial and Industrial, indicating superior relative performance (on average) in extreme market conditions (whether bullish or bearish). All four represent economically sensitive value/cyclicals market segments. Technology again scores the worst, which further illustrates the value/cyclicals rotation.
6. This week’s fundamentals-based Outlook rankings retain a moderately bullish bias, given that cyclical sector Financial and Technology are at or near the top while defensive sectors Utilities and Consumer Goods (Staples/Noncyclicals) are in the lower tier. The near-term outlook in our fundamentals-based model continues to gain visibility. Keep in mind, the Outlook Rank does not include timing, momentum, or relative strength factors, but rather reflects the consensus fundamental expectations at a given point in time for individual stocks, aggregated by sector.
ETF Trading Ideas:
Our Sector Rotation model, which appropriately weights Outlook, Bull, and Bear scores in accordance with the overall market’s prevailing trend (bullish, neutral, or defensive), moved to a bullish bias last month and suggests holding Financial (IYF), Energy (IYE), and Basic Materials (IYM), in that order. (Note: In this model, we consider the bias to be bullish from a rules-based trend-following standpoint when SPY is above both its 50-day and 200-day simple moving averages.)
If you prefer a neutral bias, the Sector Rotation model suggests holding Financial, Telecom, and Technology, in that order. On the other hand, if you are more comfortable with a defensive stance on the market, the model suggests holding Telecom, Healthcare, and Consumer Goods (Staples/Noncylicals), in that order.
An assortment of other interesting ETFs that are scoring well in our latest rankings include First Trust Dorsey Wright Momentum & Value (DVLU), Invesco Dynamic Pharmaceuticals (PJP), VictoryShares US Multi-Factor Minimum Volatility (VSMV), iShares US Home Construction (ITB), iShares US Regional Banks (IAT), SPDR S&P Homebuilders (XHB), First Trust Morningstar Dividend Leaders (FDL), Innovator IBD 50 (FFTY), First Trust NASDAQ ABA Community Bank (QABA), First Trust NASDAQ Retail (FTXD), Invesco Dynamic Building & Construction (PKB), Davis Select Financial (DFNL), iShares US Broker-Dealers & Securities Exchanges (IAI), iShares Factors US Value Style (STLV), VanEck Vectors BDC Income (BIZD), Invesco S&P 500 Equal Weight Financials (RYF), and Pacer US Cash Cows 100 (COWZ).
As always, I welcome your thoughts on this article! Please email me anytime. Any and all feedback is appreciated!
Disclosure: At the time of this writing, among the securities mentioned, the author held long positions in SPY, EEM, ZM, SQ, TTD, BEAM, QDEL, gold, bitcoin, and ether.
Disclaimer: ...
more

