
Pioneer Power Solutions Is Leading "Strong Buy" This Week
Our leader is Pioneer Power Solutions, Inc.Corporation (PPSI).
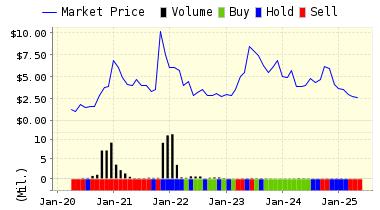
Pioneer Power Solutions, Inc. is specialty manufacturer of electrical transmission and distribution equipment. The company provides solutions in the utility, industrial and commercial segments of the electrical transmission and distribution industry. It operates primarily in the U.S., Canada, and Mexico. Pioneer Power Solutions, Inc. is headquartered in Fort Lee, New Jersey.
Recommendation: We continue our STRONG BUY recommendation on Pioneer Power Solutions for 2016-10-17. Based on the information we have gathered and our resulting research, we feel that Pioneer Power Solutions has the probability to OUTPERFORM average market performance for the next year. The company exhibits ATTRACTIVE Momentum and Price Sales Ratio.
|
ValuEngine Forecast |
||
|
Target |
Expected |
|
|---|---|---|
|
1-Month |
5.99 | 1.51% |
|
3-Month |
6.00 | 1.67% |
|
6-Month |
5.93 | 0.58% |
|
1-Year |
6.98 | 18.27% |
|
2-Year |
4.74 | -19.70% |
|
3-Year |
3.27 | -44.65% |
|
Valuation & Rankings |
|||
|
Valuation |
44.25% undervalued |
Valuation Rank |
|
|
1-M Forecast Return |
1.51% |
1-M Forecast Return Rank |
|
|
12-M Return |
51.28% |
Momentum Rank |
|
|
Sharpe Ratio |
-0.28 |
Sharpe Ratio Rank |
|
|
5-Y Avg Annual Return |
-12.11% |
5-Y Avg Annual Rtn Rank |
|
|
Volatility |
44.03% |
Volatility Rank |
|
|
Expected EPS Growth |
32.65% |
EPS Growth Rank |
|
|
Market Cap (billions) |
0.04 |
Size Rank |
|
|
Trailing P/E Ratio |
12.04 |
Trailing P/E Rank |
|
|
Forward P/E Ratio |
9.08 |
Forward P/E Ratio Rank |
|
|
PEG Ratio |
0.37 |
PEG Ratio Rank |
|
|
Price/Sales |
0.39 |
Price/Sales Rank |
|
|
Market/Book |
4.48 |
Market/Book Rank |
|
|
Beta |
2.29 |
Beta Rank |
|
|
Alpha |
0.13 |
Alpha Rank |
|
Market Overview
|
Summary of VE Stock Universe |
|
|
Stocks Undervalued |
53.93% |
|
Stocks Overvalued |
46.07% |
|
Stocks Undervalued by 20% |
22.19% |
|
Stocks Overvalued by 20% |
14.7% |
Sector Overview
|
Sector |
Change |
MTD |
YTD |
Valuation |
Last 12-MReturn |
P/E Ratio |
|
Industrial Products |
0.01% |
-2.78% |
15.53% |
5.29% overvalued |
10.63% |
23.22 |
|
Utilities |
0.14% |
-1.92% |
9.15% |
4.43% overvalued |
10.22% |
21.86 |
|
Computer and Technology |
-0.54% |
-3.12% |
14.73% |
2.55% overvalued |
3.50% |
29.42 |
|
Oils-Energy |
-0.44% |
1.31% |
34.31% |
2.54% overvalued |
-9.65% |
26.53 |
|
Multi-Sector Conglomerates |
-0.02% |
-1.30% |
6.32% |
1.75% overvalued |
-2.54% |
20.71 |
|
Consumer Staples |
-0.37% |
-2.33% |
10.20% |
1.49% overvalued |
6.81% |
23.83 |
|
Basic Materials |
0.36% |
-3.11% |
40.95% |
0.33% overvalued |
40.16% |
28.84 |
|
Finance |
-0.24% |
-1.44% |
5.77% |
0.18% undervalued |
1.90% |
16.54 |
|
Aerospace |
0.48% |
-0.60% |
2.36% |
0.30% undervalued |
4.65% |
17.89 |
|
Business Services |
-0.26% |
-2.48% |
11.95% |
2.02% undervalued |
-2.21% |
24.12 |
|
Consumer Discretionary |
-0.29% |
-2.02% |
7.56% |
3.44% undervalued |
-1.09% |
23.74 |
|
Transportation |
-0.41% |
-1.72% |
8.23% |
4.40% undervalued |
-15.62% |
16.41 |
|
Construction |
0.13% |
-1.80% |
29.33% |
5.37% undervalued |
10.70% |
19.74 |
|
Auto-Tires-Trucks |
-0.44% |
-1.97% |
5.72% |
6.41% undervalued |
6.58% |
14.92 |
|
Retail-Wholesale |
-0.59% |
-1.52% |
-0.71% |
6.47% undervalued |
-3.83% |
21.82 |
|
Medical |
-0.49% |
-2.92% |
0.06% |
7.27% undervalued |
-9.93% |
26.31 |
Disclaimer: ValuEngine.com is an independent research ...
more

