
Perspective On The Stock Market
Some people are getting a little spooked by recent stock market movements. Here I offer a few thoughts.
Although there has been a dramatic drop in the S&P 500 since October, the market had been up pretty significantly from the start of the year up to that point. As of Friday, the net change between the start of the year and now has been inconsequential.
(Click on image to enlarge)
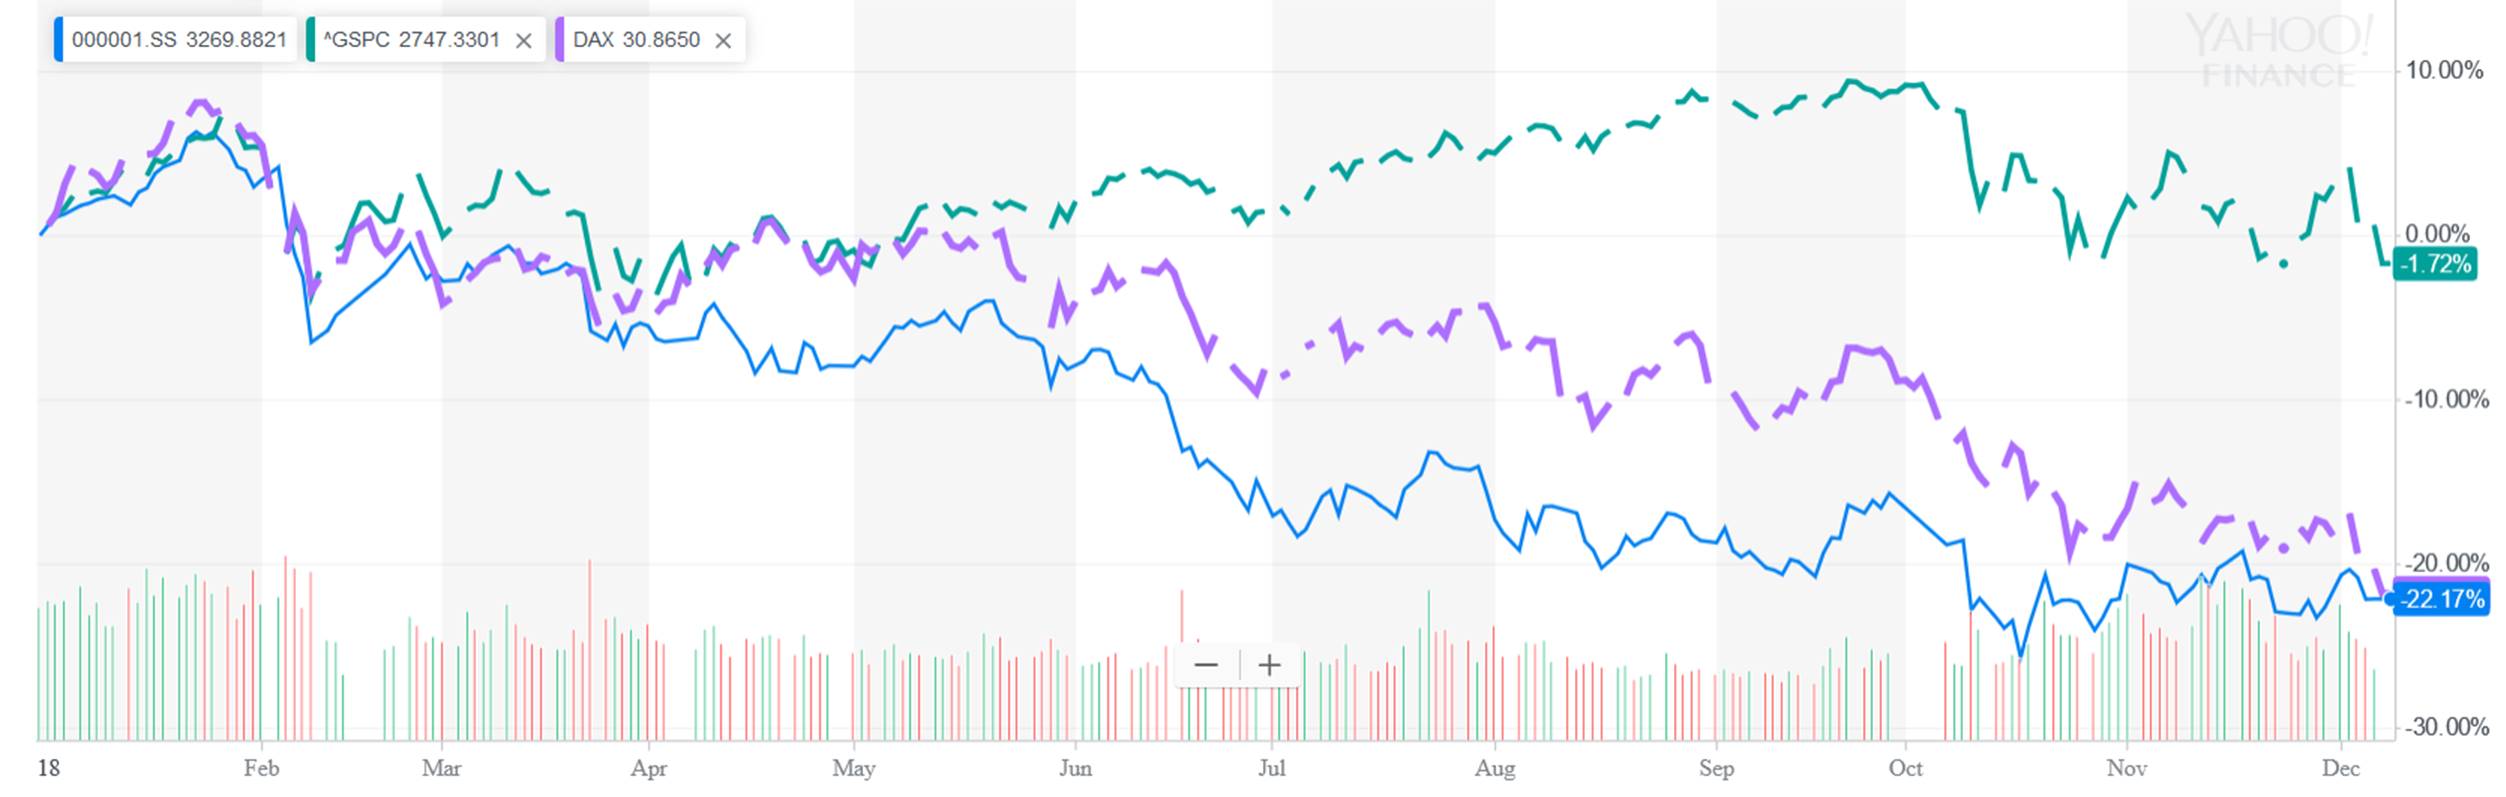
Cumulative change since start of year of U.S. S&P 500 (green), Shanghai composite (blue) and German DAX (purple). Source Yahoo Finance.
If somebody should be worried, it should be the Chinese or Europeans, where the drop in stock prices so far this year has been fairly painful. One interpretation is that bad news for them is finally catching up with the U.S.
It’s interesting that the rise and fall in U.S. equity prices this year paralleled that for the 10-year Treasury yield. That also had been climbing significantly during the year, only to drop dramatically the last few months.
(Click on image to enlarge)
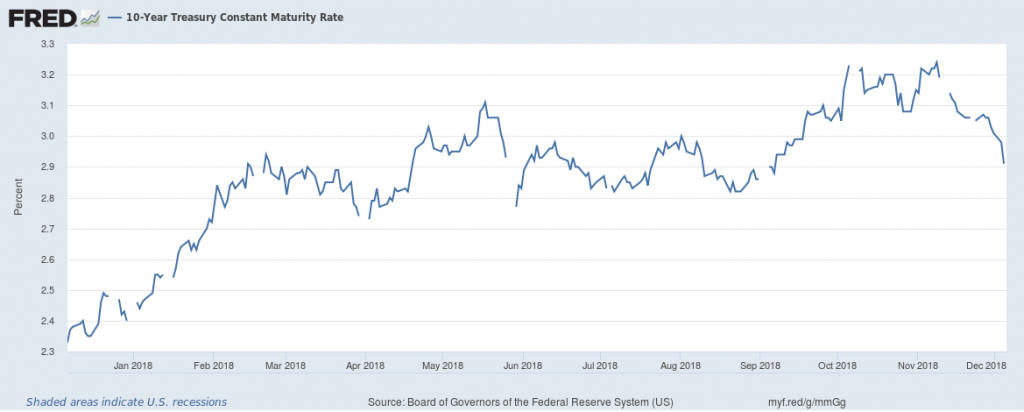
Interest rate on 10-year U.S. Treasury bond. Source: FRED.
Other things equal, lower interest rates would usually mean higher stock prices, because it means future dividends and earnings are less significantly discounted. When instead interest rates and equity prices move together, as they have been, it suggests that some third factor is driving both yields and stock prices. One possibility is that the U.S. fiscal stimulus both raised long-term real interest rates as well as near-term real growth forecasts earlier this year. One outcome I anticipate as a result of the recent U.S. election is less fiscal stimulus, which would bring both stock prices and bond yields down from earlier highs.
There are some other measures that raise some concerns. New claims for unemployment insurance are one of the best leading indicators we have, and those have been inching up. But again, that’s mostly noticeable because of the long previous decline.
(Click on image to enlarge)
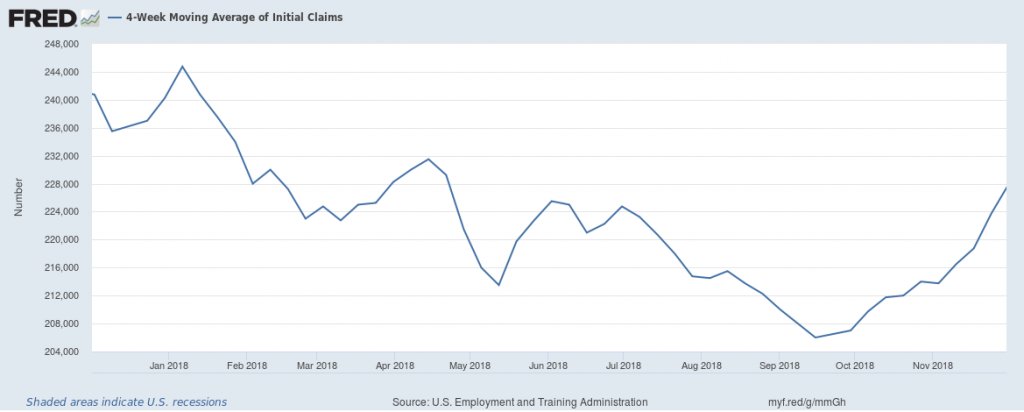
4-week average of initial claims for unemployment insurance. Source FRED.
Some analysts are darkly warning of a recession some time in the next two years. Not a particularly brave (or worrisome) forecast, that. If in any random month since 1947 you’d declared that the economy would be in recession some time in the next 2 years, 43% of the time you’d have been right. Perhaps the probability is a bit above that right now. The truth is that stuff happens– always has, always will. But exactly when we’re going to experience our next recession, no one knows at this point.
None of that is to deny that further sharp drops in U.S. stock prices are quite possible, even if there’s no new bad news. The reason is that stocks are so richly valued relative to earnings compared to historical norms. Below is an update of one of the graphs from Yale Professor Robert Shiller’s very long-term data set to which I’ve often referred. The green line is a price-earnings ratio on the S&P 500 or earlier counterparts. So as not to overstate the impact of temporary spikes up or down in earnings, Shiller relates the current inflation-adjusted stock price to the previous ten-year-average of inflation-adjusted earnings. That backward-looking P/E currently stands at 30.6, well above its average value of 16.9 in data going back to 1880. If we return anywhere near historical averages, it would mean a huge drop in stock prices.
(Click on image to enlarge)
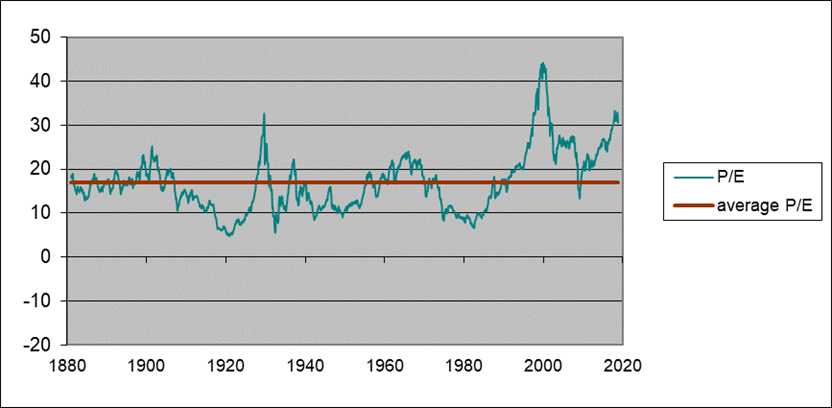
Green line: Ratio of real value of S&P composite index to the arithmetic average value of real earnings over the previous decade, January 1880 to Dec 7, 2018. Red line: historical average (16.9). Data source: Robert Shiller
Disclosure: None.


