
Peeking Into The Future Thru Futures, What Hedge Funds Were Buying This Week
Following futures positions of non-commercials are as of March 30, 2021.
10-year note: Currently net short 89.8k, up 102.1k.
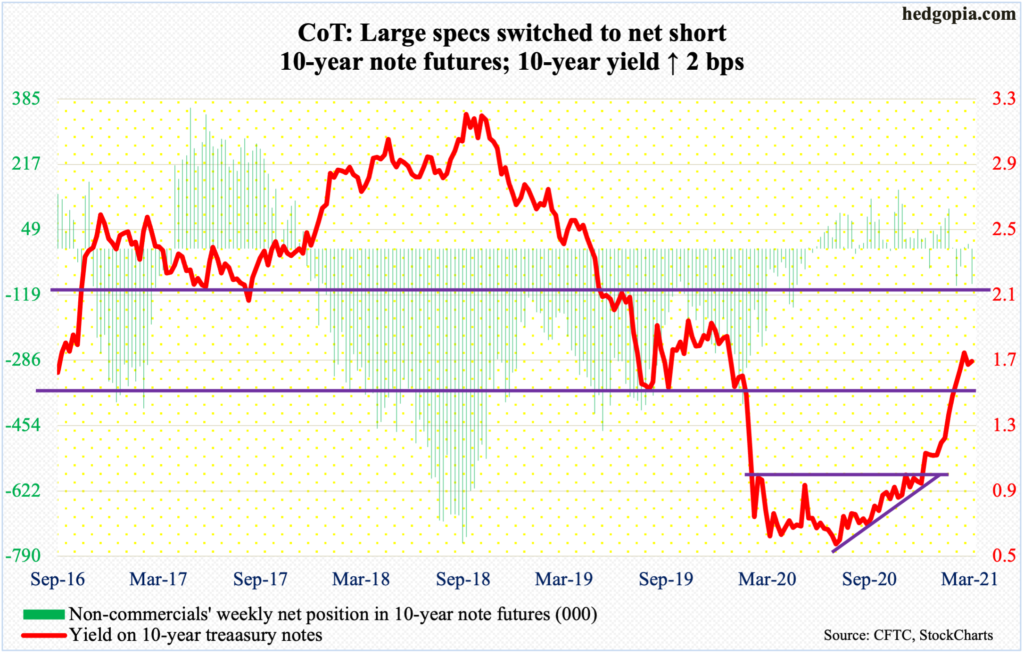
Minutes for the March 16-17 FOMC meeting will be out next Wednesday. Not much extra color is expected out of these minutes.
In the meeting, the fed funds rate was left between zero and 25 basis points; also left unchanged was the asset buying program at $120 billion/month. Rather unexpectedly, members did let markets know their expectations not to raise rates through 2023. They concurrently raised real GDP growth forecast to 6.5 percent this year, up from 4.2 percent last December; core PCE inflation forecast went from 1.8 percent to 2.2 percent.
Markets would love some clarity on this. If the economy grows anything remotely close to the consensus, it is set to surpass its pre-pandemic high. Yet here we have benchmark rates at zero bound. The long end of the treasury yield curve acts confused.
The Fed is aggressively buying treasury notes and bonds, with holdings of $4.21 trillion, up from $2.03 trillion in March last year, but the 10-year has gone from 0.40 percent to 1.68 percent, with a high of 1.77 percent on Tuesday. (Post-March jobs report Friday, the 10-year rallied to 1.72 percent.) These rates are begging the short end to come around and head higher.
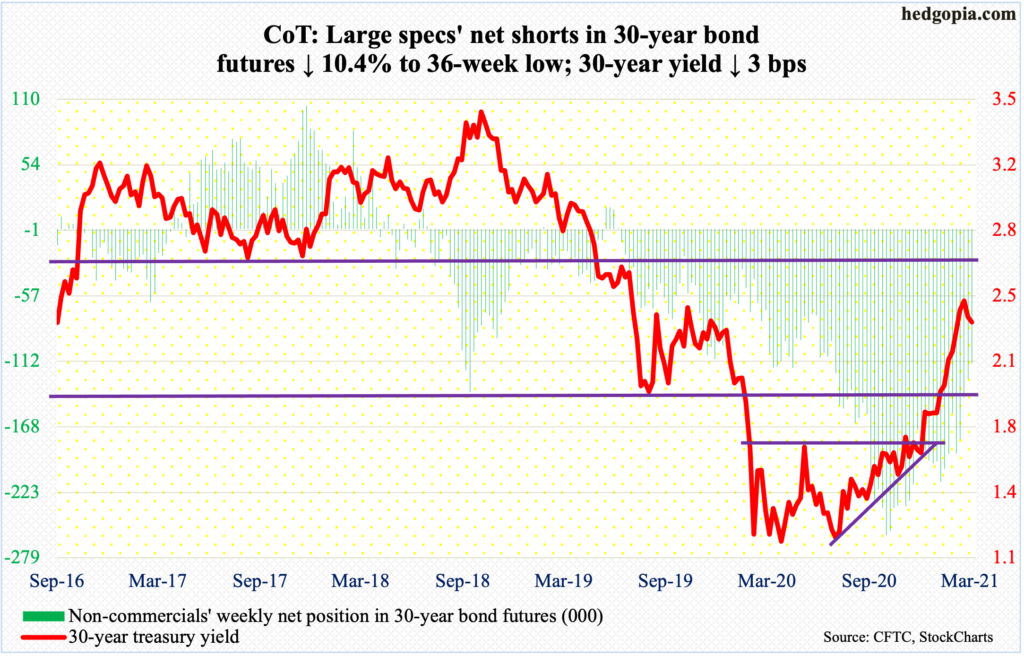
30-year bond: Currently net short 114.4k, down 13.3k.
Major economic releases for next week are as follows.
The ISM non-manufacturing index (March) and durable orders (February, final) are scheduled for Monday.
Services activity in February declined 3.4 points month-over-month to 55.3. Last April, post-pandemic, activity slumped to 41.6.
February’s preliminary data showed orders for non-defense capital goods ex-aircraft – proxy for business capex plans – increased 9.1 percent year-over-year to a seasonally adjusted annual rate of $72.5 billion. January’s $73 billion was a new record.
JOLTs job openings (February) are due out Tuesday. Non-farm openings rose 165,000 m/m in January to 6.92 million. Openings were down to 4.63 million last April.
Friday brings the producer price index (March). Producer prices rose 0.5 percent m/m in February; stripping out food and energy, prices were up 0.2 percent. In the 12 months to February, headline and core prices rose 2.8 percent and 2.5 percent respectively.
WTI crude oil: Currently net long 565.7k, down 10.4k.
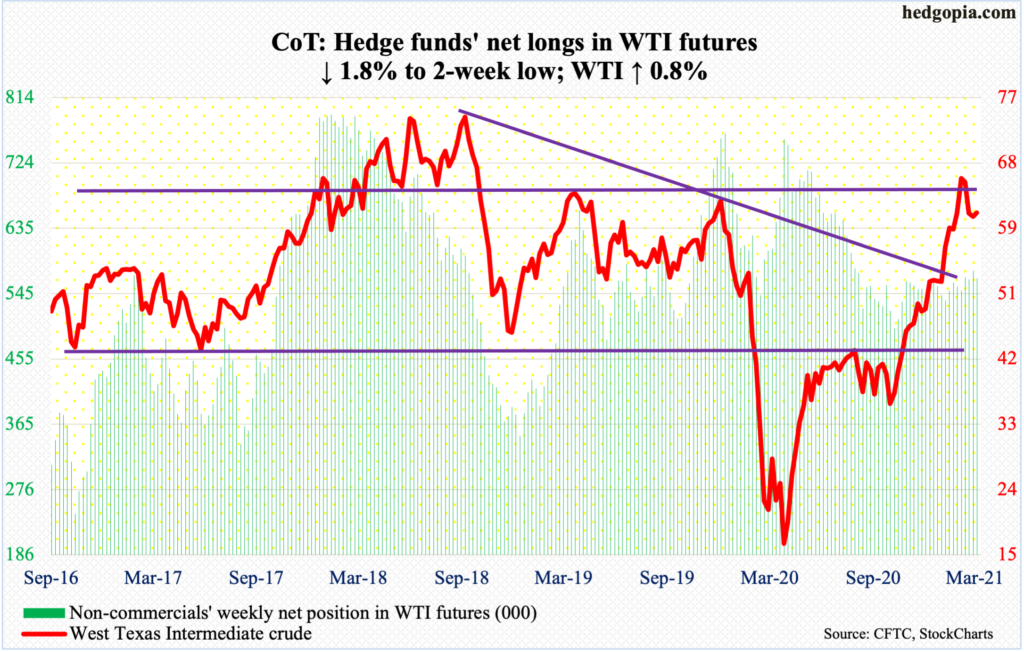
OPEC+ plans to increase production over the next three months, by a cumulative 1.1 million barrels per day. Since early November last year, WTI is up 83 percent and was up 102 percent at its March 8th high.
Evident in their new production plan, OPEC+ producers are obviously hopeful about the global economy.
In the US, crude production in the week to March 26 rose 100,000 b/d to 11.1 mb/d. Crude imports rose as well, up 523,000 b/d to 6.1 mb/d. As did distillate stocks, which were up 2.5 million barrels to 144.1 million barrels. Stocks of crude and gasoline, however, fell – down 876,000 barrels and 1.7 million barrels respectively to 501.8 million barrels and 230.5 million barrels. Refinery utilization increased 2.3 percentage points to 83.9 percent.
Despite the OPEC+ plan to raise output, WTI ($61.45/barrel) jumped 3.9 percent on Thursday, although Brent was unchanged; WTI rallied from just below its 50-day moving average, which it has hugged for over two weeks now. Should the crude manage to rally further, nearest resistance lies at $62.20s.
E-mini S&P 500: Currently net short 50.3k, up 22k.
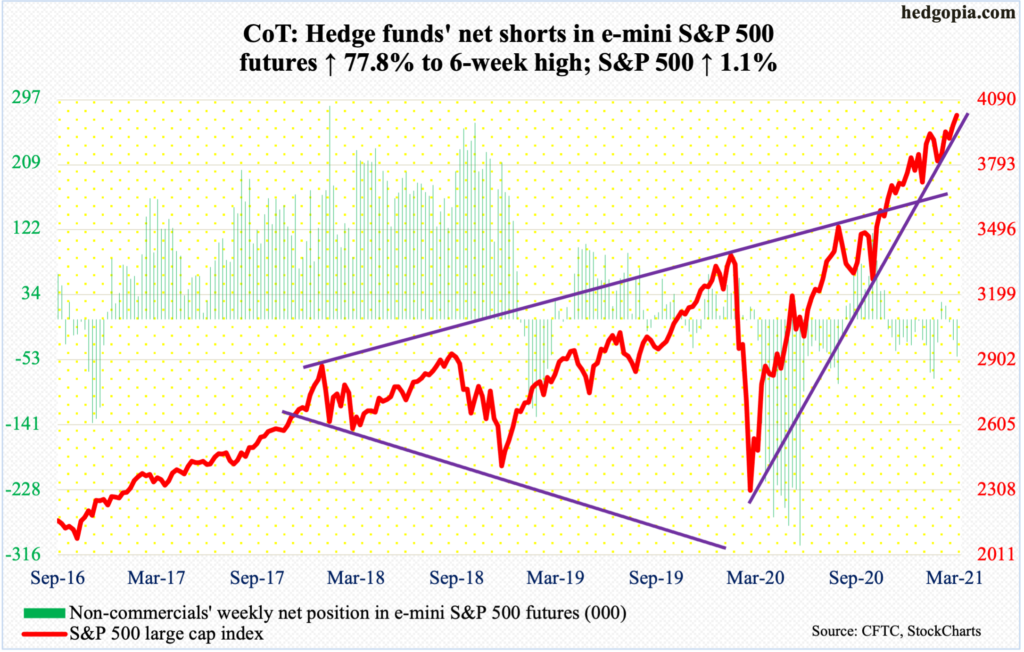
Six sessions ago, bulls defended the 50-day. Through Thursday’s high, they then rallied the S&P 500 (4019.87) 4.4 percent to post a new high (more on this here). There is now new support at 3980s.
In the week to Wednesday, SPY (SPDR S&P 500 ETF), VOO (Vanguard S&P 500 ETF) and IVV (iShares Core S&P 500 ETF) took in $514 million, much softer than the prior week’s $11.5 billion, but inflows nevertheless (courtesy of ETF.com). In the same week, US-based equity funds gained $2.6 billion, which once again was softer than the prior week’s $10.9 billion, but in the last eight weeks inflows totaled $99.5 billion (courtesy of Lipper).
In the meantime, money market funds went up $111 billion in just the last two weeks, to $4.5 trillion (courtesy of ICI). In the first quarter, these funds bulked up by $202 billion, even though the S&P 500 rallied 5.8 percent. In the past, this so-called cash-on-the-sidelines moved into stocks once the latter began to rally. Not this time. When stocks bottomed in March last year, these assets were $3.9 trillion.
As things stand, post-this week’s mini breakout, bulls have the upper hand. At this point, they must genuinely be hoping that these funds begin to contract and stocks get their fair share.
Euro: Currently net long 73.7k, down 19.6k.
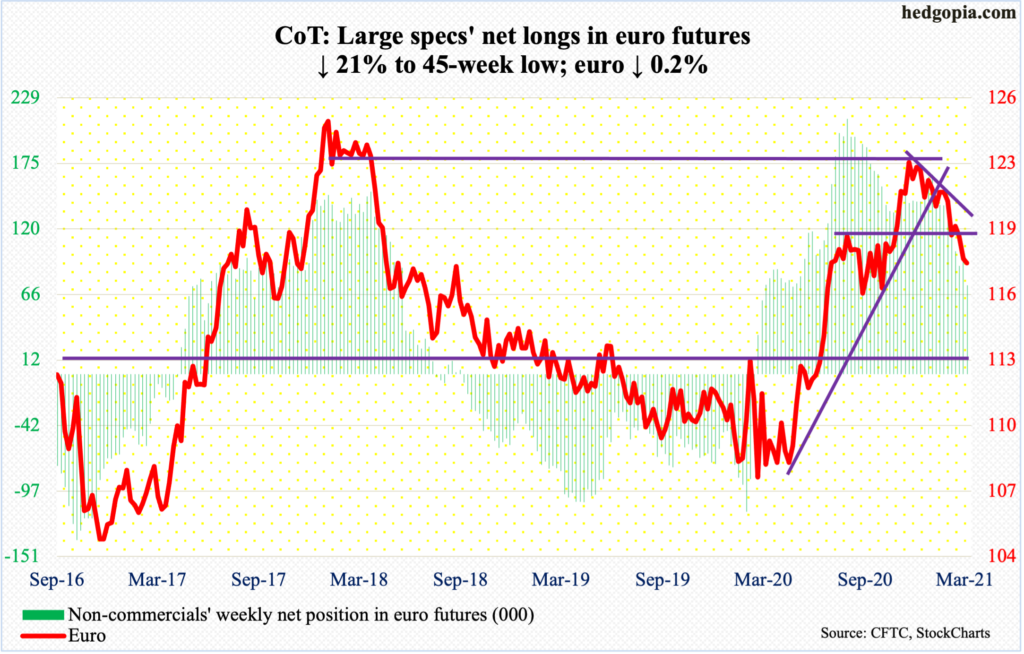
After dropping another 0.7 percent through Tuesday’s low of $1.1712, the euro ($1.1778) regained some footing to end the week only down 0.2 percent. In the end, the week formed a potentially bullish hammer.
The currency retreated after posting $1.2345 early this year.
The daily can rally. For now, $1.1840s offers the nearest resistance. This is about where the 200-day ($1.1855) lies as well.
Gold: Currently net long 167.5k, down 6.5k.
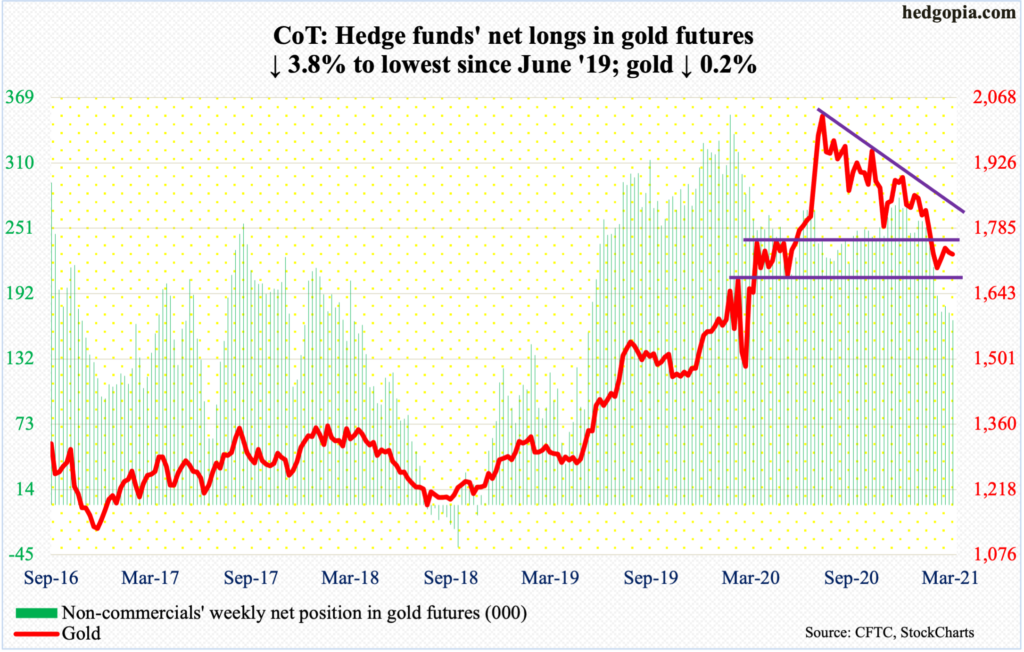
In the week through Wednesday, GLD (SPDR Gold ETF) continued to bleed, losing $309 million. In the last 24, this was the 21 weekly outflows for a cumulative loss of $13.9 billion (courtesy of ETF.com). Outflows picked up momentum in the week to October 21 last year.
Back then, bulls and bears were locked into a duel for control of $1,920s. After a last failed attempt at that level early this year, gold bugs gave up. By the 8th last month, gold ($1,728.40/ounce) was testing $1,670s. The rally that followed petered out at $1,750s – just under crucial support-turned-resistance at $1,760s-$1,770s, which was lost at the end of February and which was part of a broken descending triangle.
The metal reached its all-time high of $2,089.20 on August 7 last year, followed by a series of lower highs. If the descending triangle pattern completes, the metal could eventually head toward $1,440s. But before that happens, $1,670s needs to give way – at least. This support was once again tested this week, and once again bulls came through.
A test of $1,760s-$1,770s probably lies ahead. Incidentally, this is where the 50-day ($1,771.93) now lies. A breakout will be a big win for the bulls. At least until Tuesday, non-commercials do not have high hopes, as they cut their net longs to a 22-month low.
Nasdaq 100 index (mini): Currently net short 17.9k, up 5.2k.
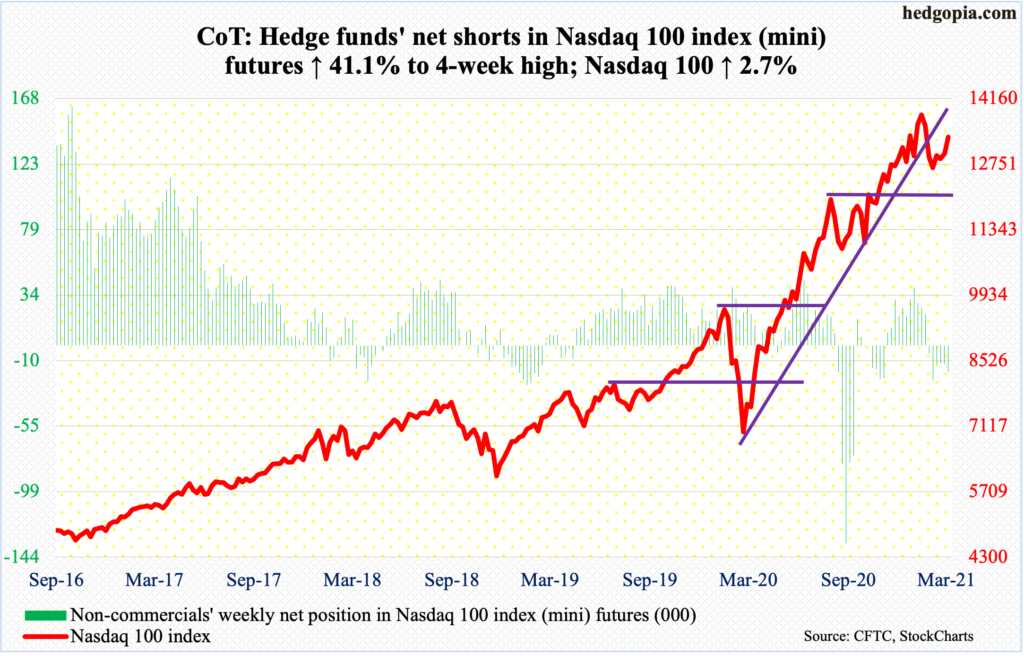
Through the 5th, the Nasdaq 100 was down as much as 5.4 percent in March but recovered to end the month up 1.4 percent; as a result, a monthly dragonfly doji formed. This candle shows sellers were aggressive but that the buyers were able to absorb all the selling. But the important thing to remember here is that selling picked up speed. March’s action followed February’s monthly shooting star and January’s long-legged doji. Tech decidedly acts different this year.
Near term, after the March 5th low, the Nasdaq 100 (13329.51) put in a higher low on the 25th. On Thursday, it reclaimed the 50-day. A gap from February 22 gets filled at 13540s. Bulls are probably eyeing that for now.
Russell 2000 mini-index: Currently net short 10k, up 19.2k.
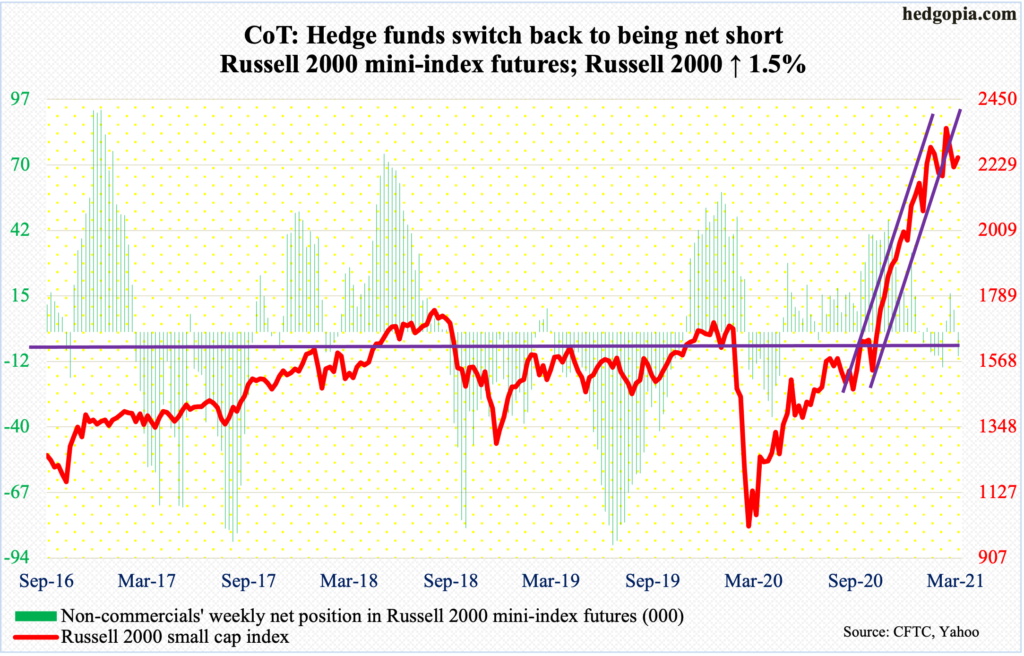
On both Tuesday and Wednesday, bids showed up at short-term support at 2150s. Earlier last week, the Russell 2000 (2253.90) just about tested horizontal support at 2070s-2080s – successfully.
There is room for the daily to rally. The small cap index peaked on March 15 at 2360.17. In the selloff that followed, an ascending channel from late October-early November last year was breached. March was an up month – sixth straight and 11 out of last 12 – but also formed a monthly spinning top. This showed up after rallying 144 percent from the low of March last year. That is a lot of paper gains not to be tempted to lock in.
US Dollar Index: Currently net long 5.7k, up 343.
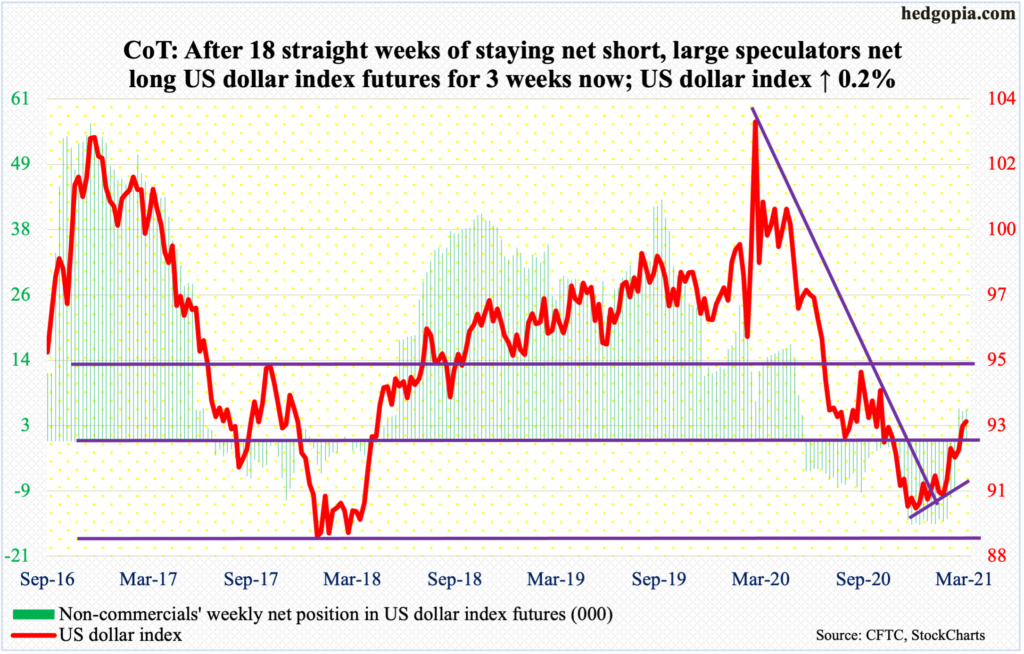
The US dollar index managed to rally 0.2 percent this week – fifth up week in last six – but at the same time was unable to hang on to all of the gains. Through Wednesday’s high of 93.47, the index (92.95) was up 0.7 percent; the session ended up with a spinning top, even as the weekly produced a shooting star.
From early this month when it bottomed at 89.17 (support at 88-89 goes back to May 2004), the US dollar index rallied just under five percent before this week’s rather lethargic action. The 200-day lies at 92.66, followed by a breakout retest just north of 92, which has proven to be an important level going back 18 years. This will be an important test.
VIX: Currently net short 94.4k, down 7.9k.
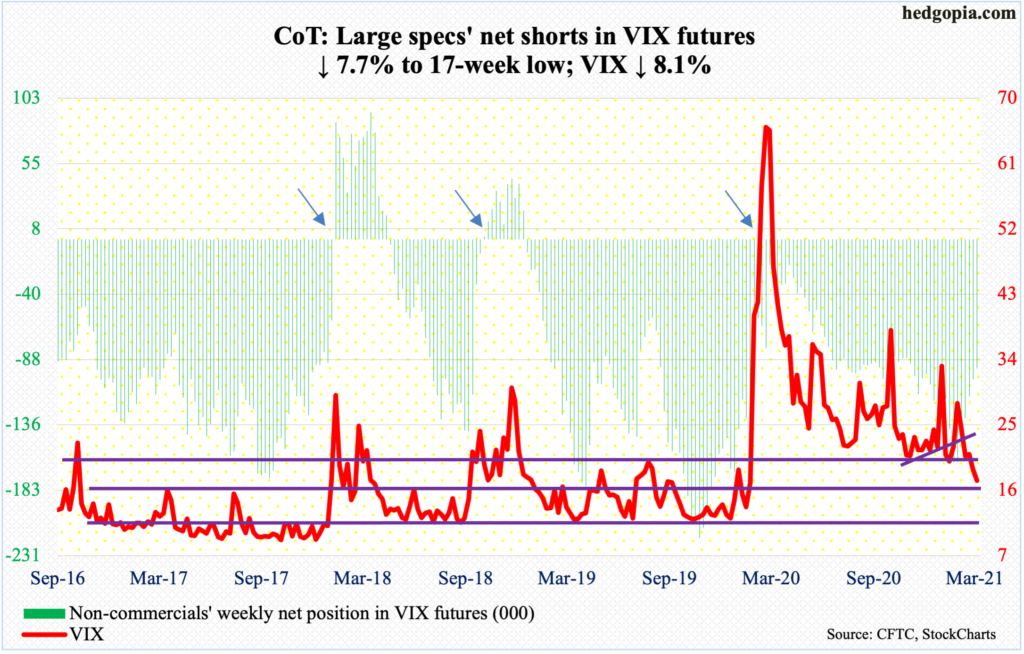
VIX suffered a mini breakdown of sorts.
Last week, the volatility index (17.33) breached low-20s to close at 18.86. This week, Tuesday’s rally attempt was rejected at the 20-day as VIX retreated after tagging 21.75; by Thursday, short-term support just under 19 was compromised.
The path of least resistance near term is toward the mid-teens.


