
Peek Into The Future Through Futures
Following futures positions of non-commercials are as of January 21, 2020.
10-year note: Currently net short 302.5k, up 79k.
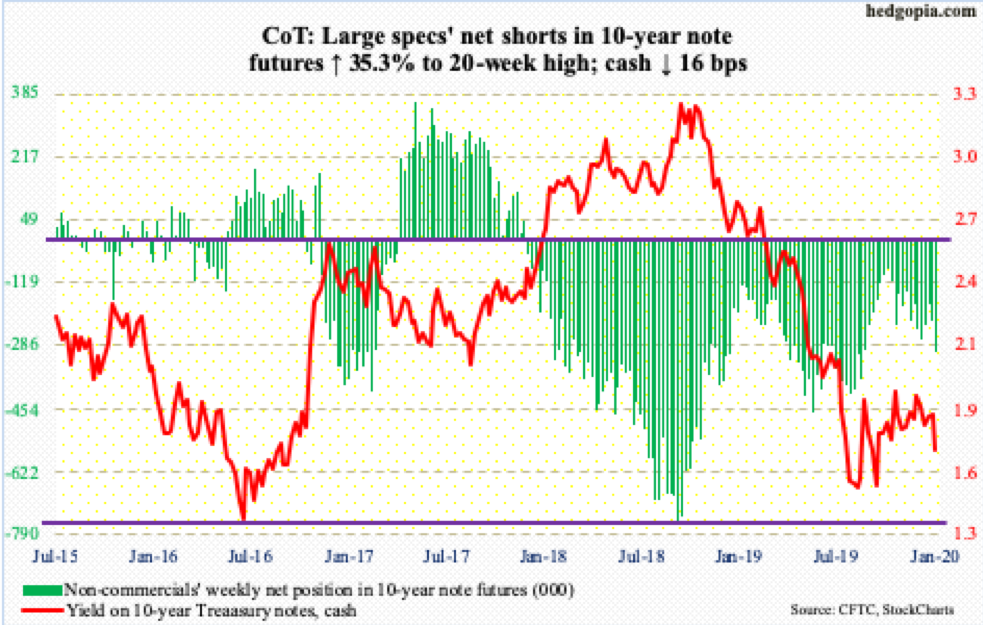
The FOMC meets next week – on 28-29, the year’s first meeting. Markets do not expect the Fed to move.
This comes on the heels of three 25-basis-point reductions last year, to a range of 150 to 175 basis points. As things stand, Fed funds futures are leaning toward one more 25-basis-point cut by November/December. Should it come to pass, the policy rate obviously will have dropped further – closer to one percent. For this to occur, the US economy likely needs to decelerate quite a bit.
In this scenario, the Fed’s traditional monetary toolbox is just about empty. As relates to the benchmark rate, there are not enough arrows in its monetary quiver. The bank is all but certain to use non-traditional methods, such as quantitative easing. Arguably, it already is. SOMA (System Open Market Account) holdings have gone up from $3.55 trillion late September last year to $3.76 trillion this week.
Prior to this latest buildup, the balance sheet was getting trimmed, but from a very bloated level. SOMA holdings, which make up the majority of the Fed’s balance sheet, peaked at $4.24 trillion in April 2017, up from under $500 billion pre-2008/2009 financial crisis. Despite the nearly 11 years of expansion in the economy, the Fed was not able to cut its balance sheet to the right size. Last fiscal year, the US budget deficit crossed $1 trillion, and this likely only gets worse, and with it the size of the Fed’s balance sheet.
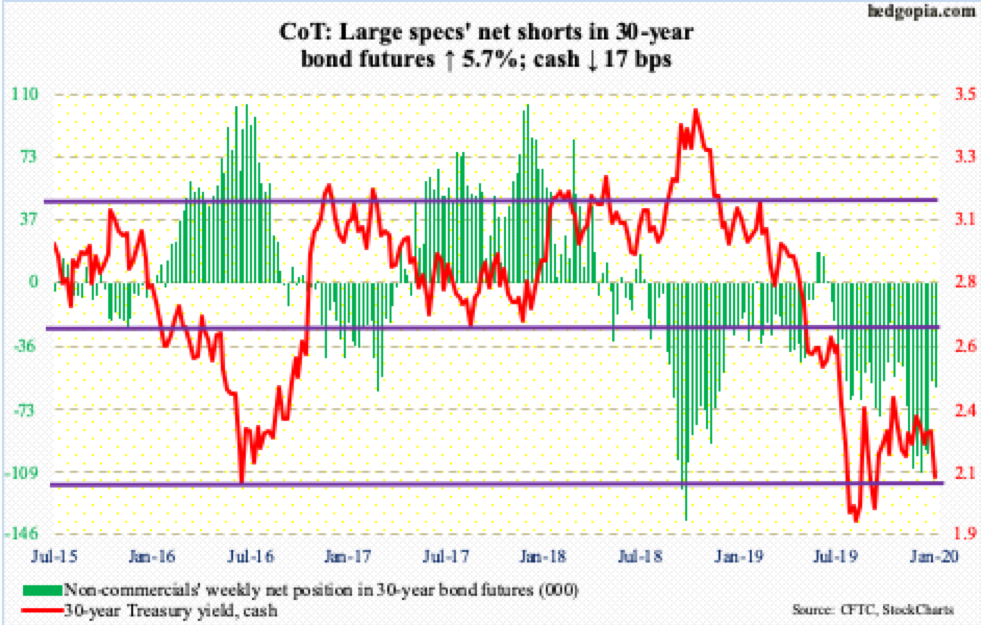
30-year bond: Currently net short 60.4k, up 3.2k.
Major economic releases next week are as follows.
New home sales (December) are due out Monday. Sales rose 1.3 percent month-over-month in November to a seasonally adjusted annual rate of 719,000 units. The cycle-high 730,000 was hit last September.
Tuesday brings durable goods orders (December) and the S&P Case-Shiller home price index (November).
In the 12 months to November, orders for non-defense capital goods ex-aircraft – proxy for business capex plans – inched up 0.4 percent to $69.3 billion (SAAR). This was the first y/y growth in five months. Orders peaked at $70 billion in July 2018.
Nationally, home prices in October appreciated 3.3 percent year-over-year. This is much slower than the 6.5 percent pace recorded in March 2018 but a tad stronger than last July’s 3.2 percent.
GDP (4Q19, advance) will be published Thursday. As of January 17, the Atlanta Fed’s GDPNow model forecasts growth of 1.8 percent. In 3Q19, the economy grew at a 2.1 percent rate.
Friday has on deck the employment cost index (4Q19), personal income (December) and the University of Michigan’s consumer sentiment index (January, final).
Private-sector compensation costs increased 2.7 percent y/y in 3Q19, with wages & salaries rising three percent and benefits two percent.
Core PCE – the Fed’s favorite measure of consumer inflation – rose 1.61 percent y/y in November. This was the 14th sub-two percent monthly reading. The Fed has a two percent objective.
Preliminarily, January consumer sentiment slipped two-tenths of a point m/m to 99.1. Except for last August’s 89.8, sentiment has been 90 or higher since November 2016, four of which were 100 or higher.
WTI crude oil: Currently net long 710.9k, down 8.2k.
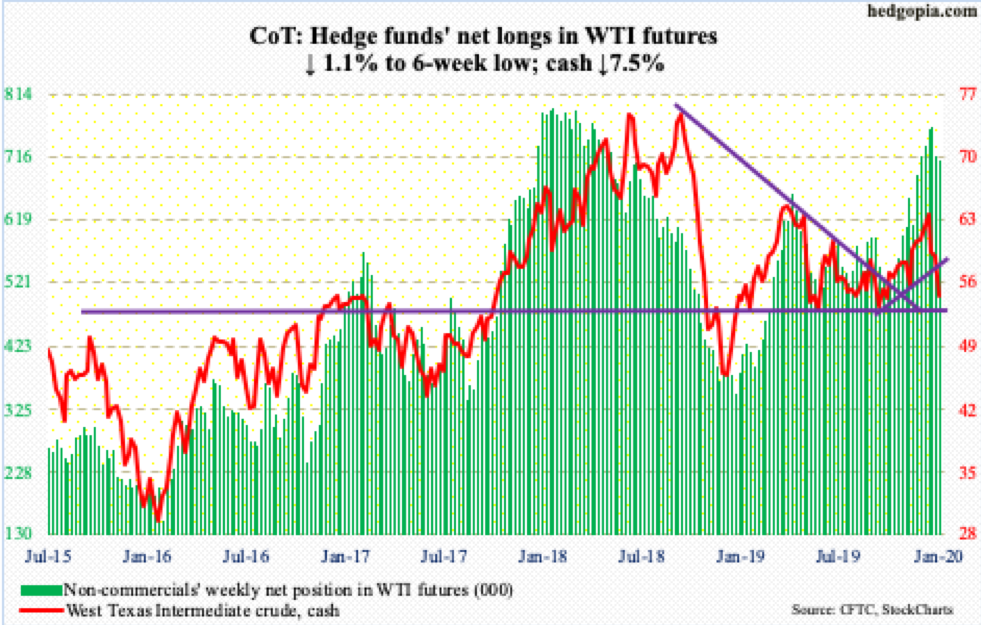
The EIA data for the week of January 17 was not that bad. US crude production remained unchanged at 13 million barrels/day. Crude imports decreased 120,000 b/d to 6.4 mb/d. Stocks of crude and distillates fell – down 405,000 barrels and 1.2 million barrels respectively to 428.1 million barrels and 146 million barrels. Gasoline inventory, however, rose 1.7 million barrels to 260 million barrels. Refinery utilization dropped 1.7 percentage points to 90.5 percent. The report was published Thursday because of the Martin Luther King Jr. holiday. But the damage was done by then.
The week started Tuesday with an unsuccessful attempt to clear the 50-day moving average. Then on Wednesday, the cash ($54.19/barrel) sliced through the 200-day. Friday, oil bulls were clinging on to a rising trend line from December 2018. Breach risks are rising. Between June and September last year, bulls stepped up in defense of $50-51 several times. Immediately ahead, $55 offers resistance.
E-mini S&P 500: Currently net long 4.6k, down 28.4k.
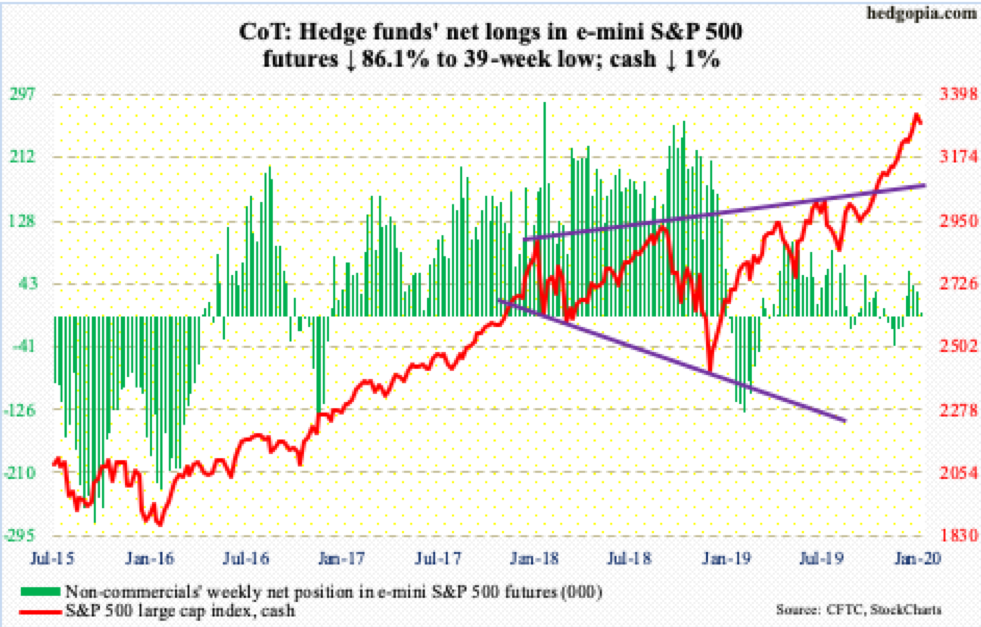
After eight weeks of positive flows in a row, SPY (SPDR S&P 500 ETF), VOO (Vanguard S&P 500 ETF) and IVV (iShares Core S&P 500 ETF) together lost $2.3 billion in the week to Wednesday (courtesy of ETF.com). In the same week, US-based equity funds gained $69 million (courtesy of Lipper); this preceded three successive weekly outflows totaling $11.6 billion.
The cash (3295.47) rallied Wednesday to a new intraday high of 3337.77 before some selling was witnessed. Thursday, the 10-day was defended but bulls were unable to save it on Friday. Now, the 20-day (3274) is the one to watch. Odds are beginning to favor bears at this point in time. Friday, the daily RSI, at 61.6, dropped back below 70, even as the MACD (26/12) crossed under. Things remain crazy overbought, weekly and monthly including.
Euro: Currently net short 47k, down 1.2k.
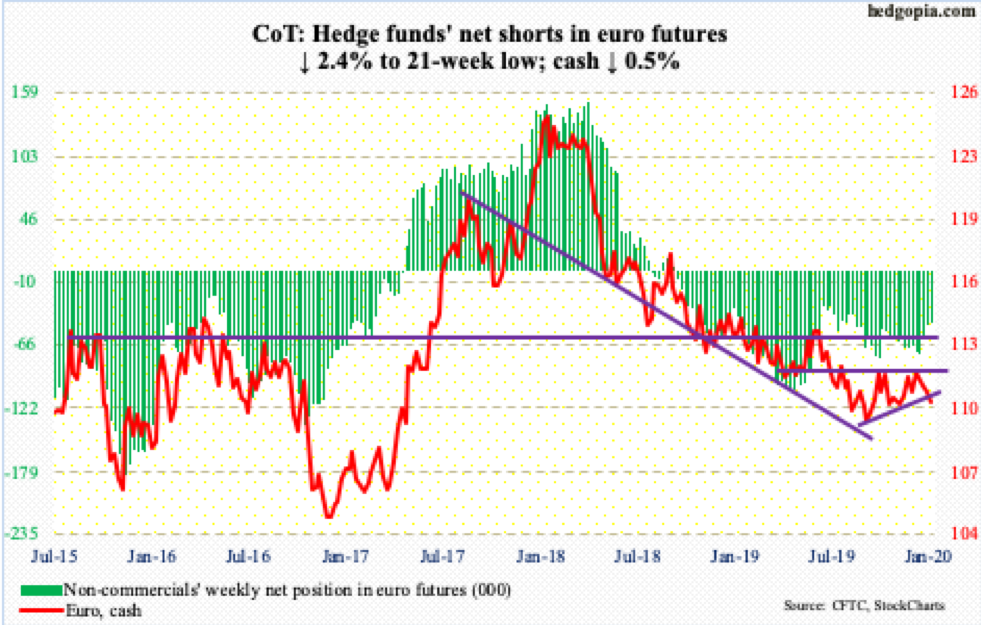
In this week’s governing council meeting, the ECB pretty much left everything as it is, with one minor change in its inflation outlook. It said there are further indications of a “moderate increase” in line with previous expectations. This represented a subtle shift from December’s “mild” and October’s “muted” language.
Cash ($110.25) traders were not sure how to react to this. Thursday’s was a volatile session, with a high of $111.08 and a low of $110.35; by close, a rising trend line from last September was lost, albeit mildly. For now, there is horizontal support just under $110.
Gold: Currently net long 317.7k, down 1.5k.
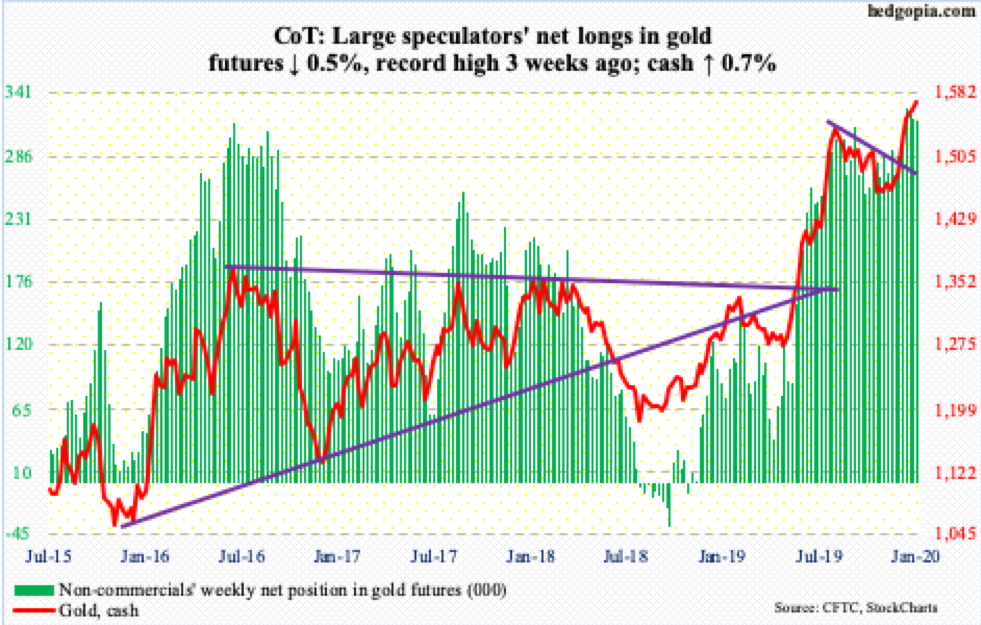
Even as bulls and bears are fighting over control of $1,550s-60s, which has proven to be an important price point going back to April 2011, $1 billion moved into GLD (SPDR Gold ETF) in the week to Wednesday (courtesy of ETF.com). This was the highest weekly total since the last week of September last year, offsetting the loss of $741 million in the prior couple of weeks. In the same week, IAU (iShares Gold Trust) took in $90 million.
On the 8th this month, the cash ($1,571.90/ounce) reversed hard after printing $1,613.30 intraday. At the same time, support thus far is holding, including the 10- and 20-day, with gold bugs having defended the former all week.
Nasdaq 100 index (mini): Currently net long 9k, down 7.7k.
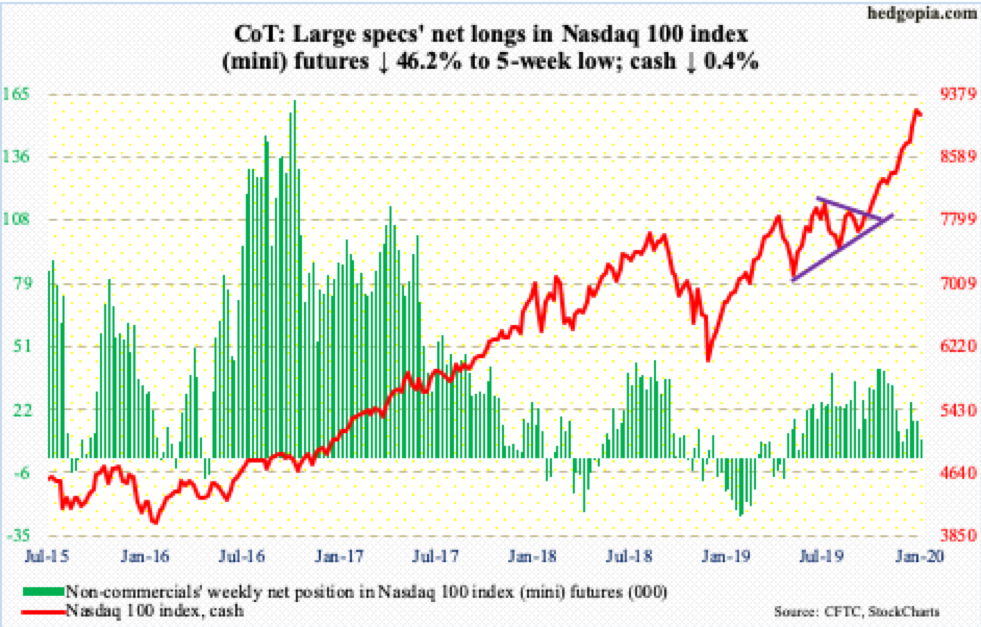
In the week to Wednesday, $2.5 billion was redeemed from QQQ (Invesco QQQ Trust). This was the highest weekly loss since the first week of August last year when $2.7 billion was withdrawn (courtesy of ETF.com).
Wednesday, the cash (9141.47) went on to post a new intraday high of 9242.48, although bulls were unable to hang on to all of it by close. Friday formed a potentially bearish engulfing candle; the 10-day was defended, but bulls may be allowing bears an opening here. The rubber band is way stretched.
Russell 2000 mini-index: Currently net long 54.3k, up 5.6k.
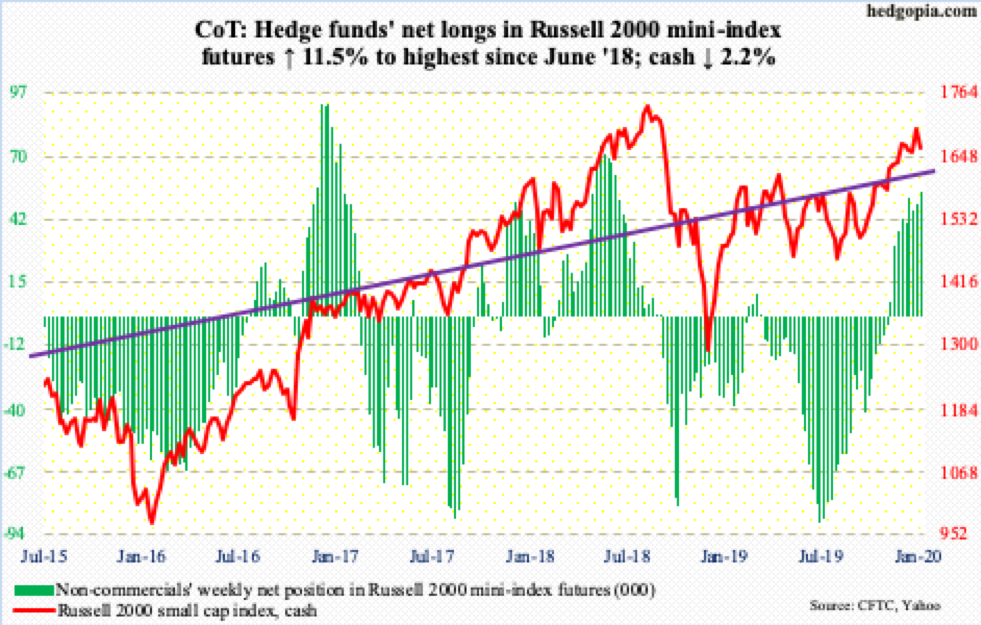
In the week to Wednesday, IWM (iShares Russell 2000 ETF) lost $824 million and IJR (iShares Core S&P Small-Cap ETF) $8 million (courtesy of ETF.com).
Intraday Thursday, the cash (1662.23) dropped all the way to 1666.47 before bids showed up to close at 1685.01, essentially right at dual support – one-month horizontal plus rising trend line from last October. Friday, that floor was gone. Since retreating after tagging 1715.08 intraday on the 17th, small-caps have not been sending good vibes. They have lagged their large-cap peers for a while.
Non-commercials remain bullish, with net longs at the highest since June 2018. If weakness in the cash persists, they may decide to lock in gains. Major breakout retest takes place just north of 1600.
US Dollar Index: Currently net long 12.9k, down 323.
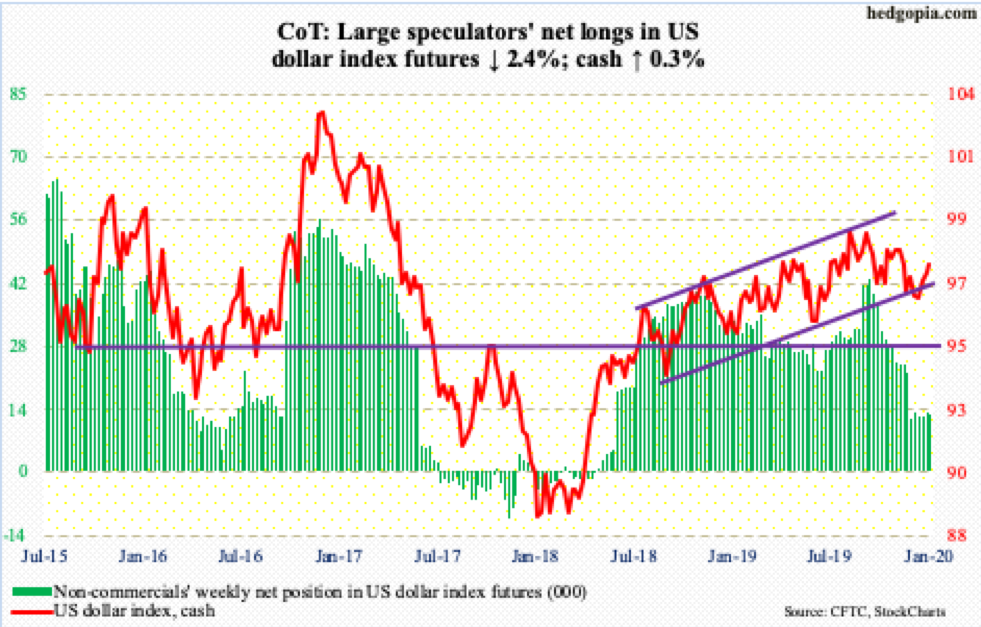
Dollar bulls put foot down. Late December, there was a brief breach of a rising trend line from September 2018, but they quickly regrouped. The cash (97.65) rallied the last three weeks. Thursday, it rallied past both the 50- and 200-day (97.32 and 97.46, respectively) but only to then face resistance Friday at a falling trend line from last October. As things stand, the US dollar index remains sandwiched between these two trend lines – 97.70s above and 96.70s below.
VIX: Currently net short 170.2k, up 2.6k.
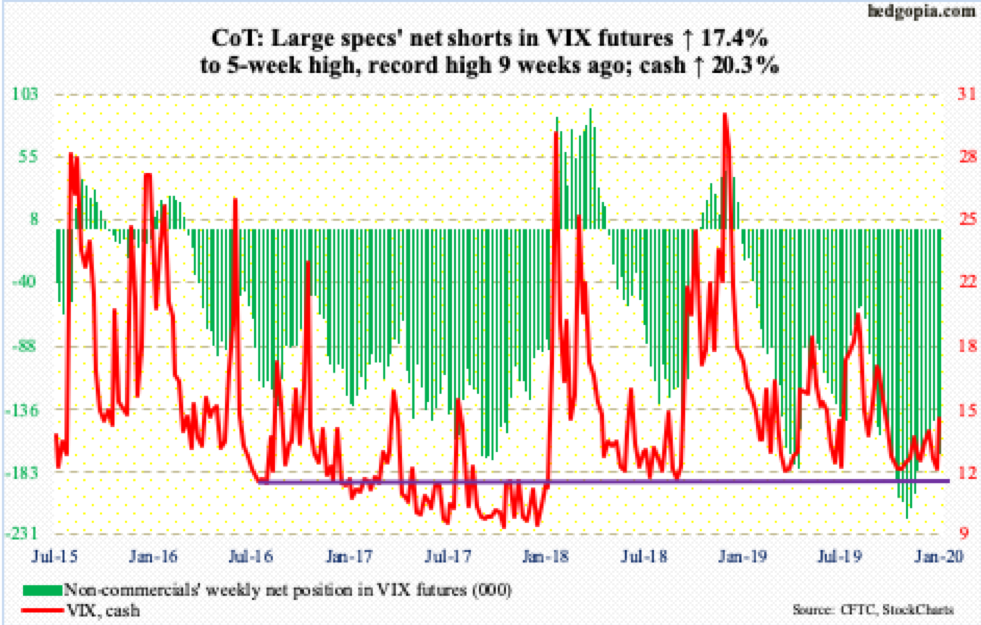
After last week’s several intraday drops into the high 11s, the cash (14.56) rallied 2.46 points this week. It would have finished the week slightly higher, but once again that falling trend line from last August when VIX peaked at 24.81 came in the way. At the session high of 15.98 Friday, VIX was on its way to a breakout but was pushed under by close. Breakout will occur just north of 15, just above the 200-day at 14.93. Takeout of these levels will have changed volatility dynamics – at least near term.


