
Peek Into Future Through Futures, How Hedge Funds Are Positioned - Tuesday, Jan. 5

Following futures positions of non-commercials are as of December 29, 2020 (data was made public this Monday instead of last Friday due to New Year’s holiday).
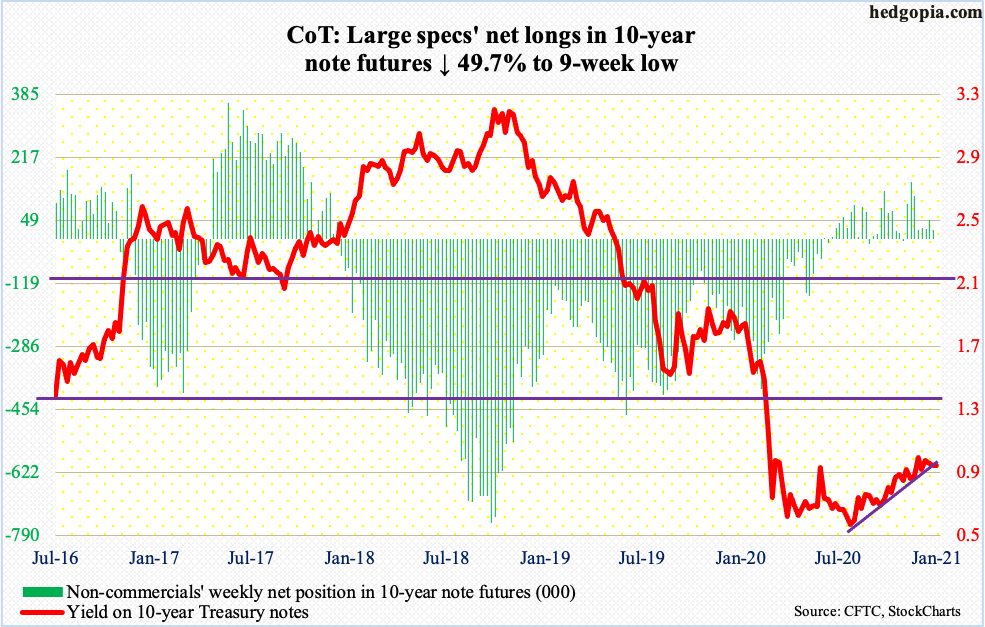
10-year note: Currently net long 25.2k, down 24.9k.
FOMC minutes for the December 15-16 meeting will be released tomorrow. This was the last scheduled meeting of 2020. For the uninitiated, there are eight scheduled meetings in a year. In addition, the Fed holds unscheduled meetings, should the need be, as was the case last March.
Not a whole lot is expected to come out of Wednesday’s minutes. The Fed obviously left the fed funds rate unchanged in that meeting. Rates are already zero-bound. Speaking to the press at the end of the meeting, Chair Jerome Powell said the central bank would adjust its quantitative easing program if the need be but for now would purchase at least $120 billion/month in US treasury bonds and mortgage-backed securities.
Bond bears (on price) are on the other side of the Fed on this. Thus far, they have waged a losing battle. The 10-year Treasury yield (0.92 percent) tried to reclaim one percent several times in November and December, but to no avail. Rates have not been over that threshold since last March. The closest was on the 4th last month when these notes yielded 0.99 percent before reversing lower.
On the weekly, there is room for the 10-year to head lower.
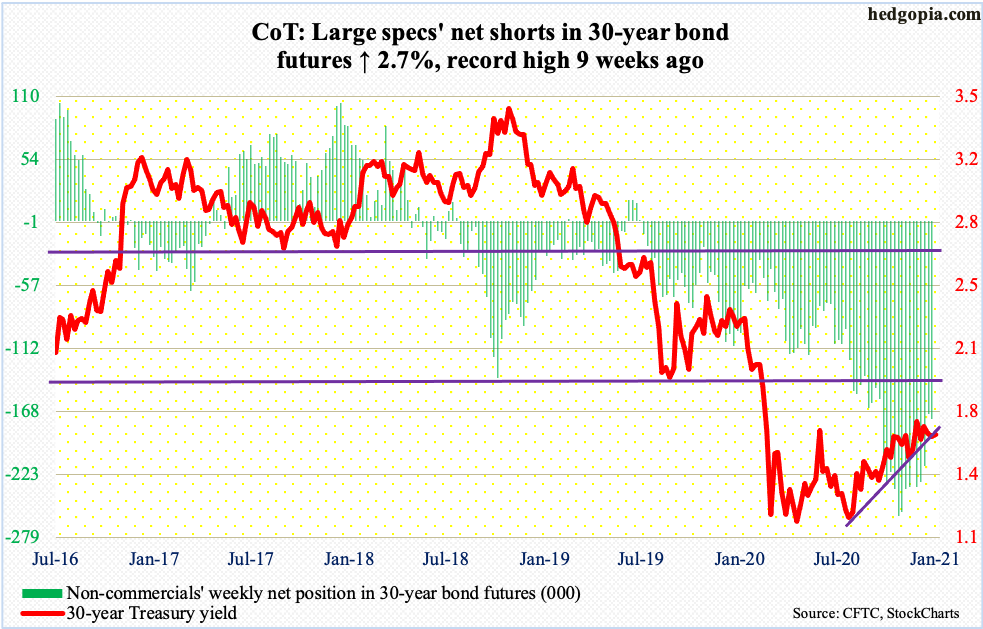
30-year bond: Currently net short 175k, up 4.6k.
Major economic releases for the remainder of the week are as follows.
The ISM manufacturing index (December) comes out later this morning. In November, manufacturing activity dropped 1.8 points from October’s 59.3, which matched the high of September 2018.
Durable goods orders (November, revised) are scheduled for Wednesday. The advance estimate showed orders for non-defense capital goods ex-aircraft – proxy for business capex plans – rose 0.4 percent m/m in November to a seasonally adjusted annual rate of $70.9 billion – a new record. Earlier in April, orders were down to $61.3 billion.
The ISM non-manufacturing index (December) is on tap for Thursday. Services activity in November fell seven-tenths of a point m/m to 55.9.
Friday brings the employment report (December). Between February and April, the US economy lost 22.2 million non-farm jobs. Then, through November’s 142.6 million, 12.3 million jobs were created.
WTI crude oil: Currently net long 544.4k, down 7.4k.
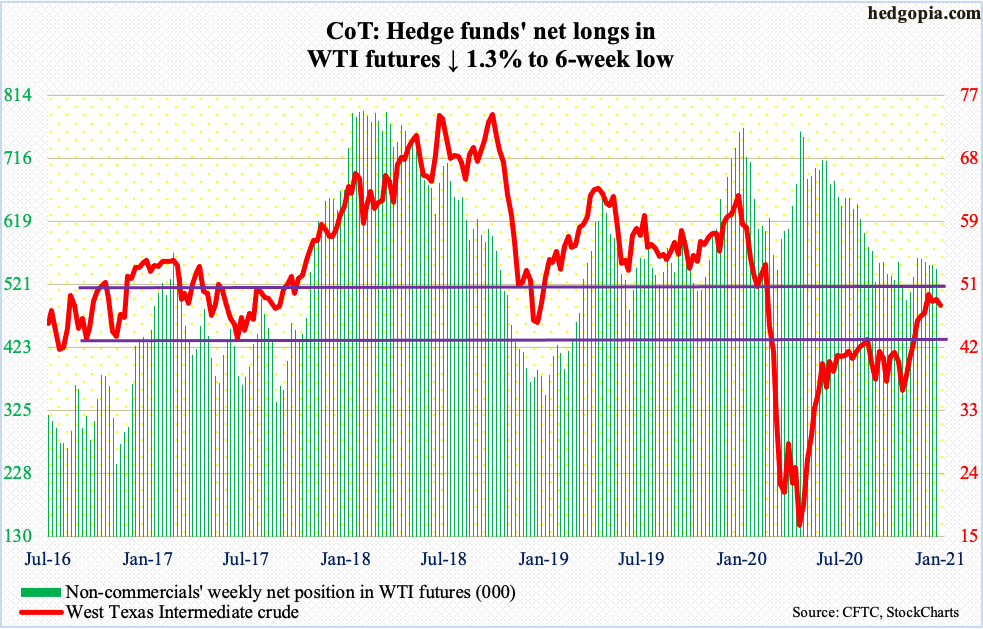
Oil bulls and bears are fighting for control of the 10-day moving average. This has gone on for two weeks now, when early on the 20-day was tested as well – successfully. Monday, WTI rallied to $49.83 intraday but only to reverse hard and close at $47.62/barrel.
The current action precedes a $42-$43 breakout six weeks ago, subsequent to which the crude rallied to tag $49.43 on December 18, before essentially going sideways. There is major horizontal resistance at $49-$50. Unless this gets taken out, the risk is to the downside – if nothing else just to unwind overbought conditions.
Importantly, a rising trend line from the low of last March also extends to $42-$43. It will be an important test.
E-mini S&P 500: Currently net short 30.8k, up 6.3k.
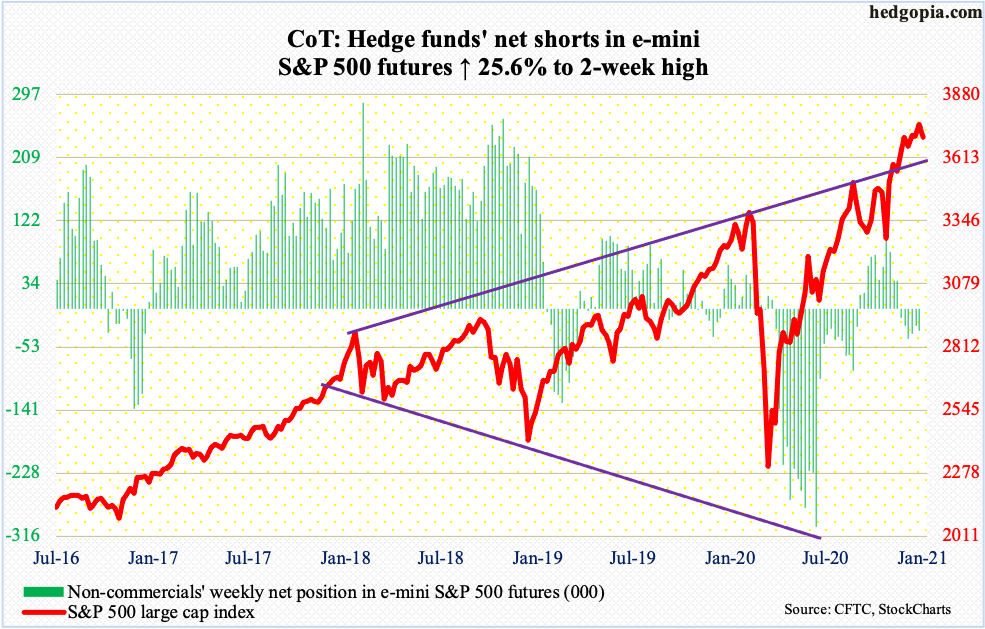
On its way to closing 2020 with a new high, the S&P 500 last week enjoyed a mini breakout – out of 3720s. There have been seven other years in which the large cap index closed with a new high; in five of them, it finished in the green in the following year as well. Plus, the index jumped 14.9 percent in November and December; in the past, after a two-month move of that magnitude, more gains followed.
Of course, for this to come true, several pieces have to fall into place. Bulls probably would like more cooperation from fund flows than they did in 2020. All the better if margin debt maintains its momentum intact since last March, not to mention foreigners’ love for US stocks of late. A pickup in corporate buybacks will help, too; boards can increase spending if this year’s elevated earnings estimates come through (more on this here).
Going into Monday’s session, bulls held the momentum card. Bears will have the upper hand once 3640s and 3580s give way, with the former corresponding to Pfizer’s announcement of its positive vaccine news (November 9) and the latter a prior record high (September 2).
Yesterday’s reversal could prove to be important; the S&P 500 (3700.65) posted a new intraday high of 3769.99 and then reversed, dropping as low as 3662.71. Bears have an opportunity here to get active.
Euro: Currently net long 143.1k, down 826. (FXE)
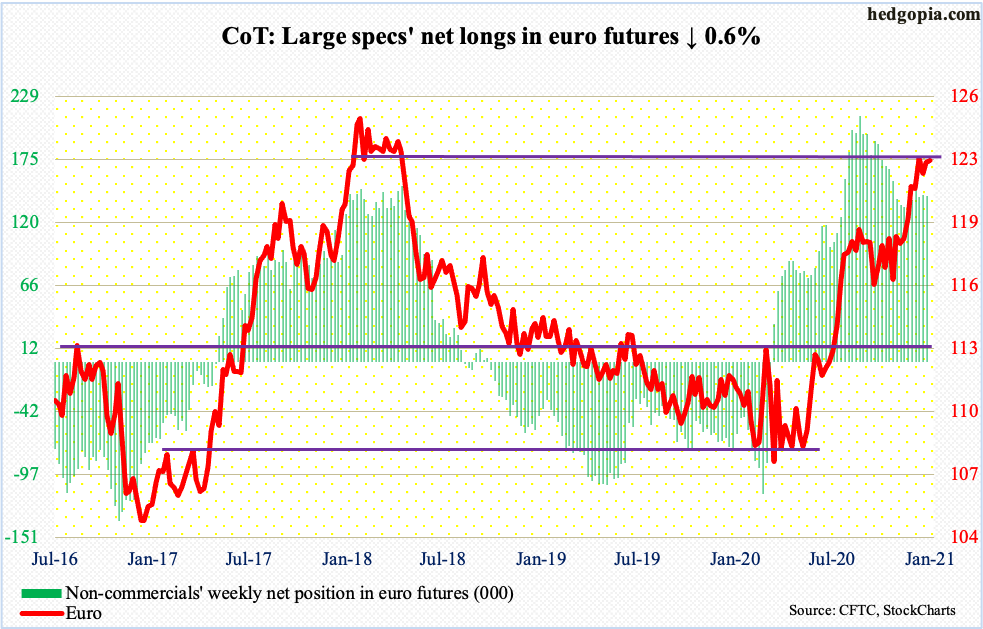
Last week, the euro ($1.225) rallied as high as $1.2310 but only to finish at $1.2239. The resulting weekly shooting star has appeared after a major rally from $1.0635 from last March. The currency remains above resistance-turned-support at $1.21-$1.22 but risk-reward odds favor weakness in the weeks ahead.
A loss of $1.2170s raises the odds the $1.19-$1.20 breakout of late November gets retested. This has been an important price point going back to May 2003. This is where the 50-day ($1.1982) lies as well.
Gold: Currently net long 268.9k, down 9.3k. (GLD)
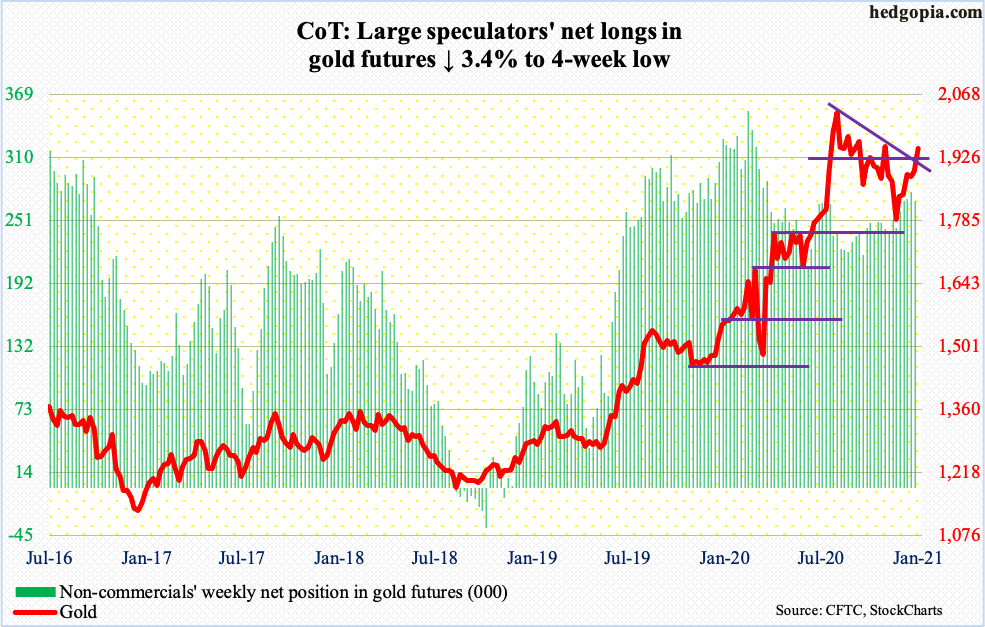
Before Monday’s 2.7-percent surge, gold ($1,946.60/ounce) for two weeks attracted bids intraday at its 10-day. Along the way, it also held horizontal support at $1,850s. Yesterday’s rally not only took care of a falling trend line from August 7 when the metal peaked at $2,089.20 but also reclaimed $1,920s, which is where gold peaked in September 2011.
The path of least resistance is higher as long as $1,920s is not violated.
Nasdaq 100 index (mini): Currently net long 19.8k, down 11.4k.
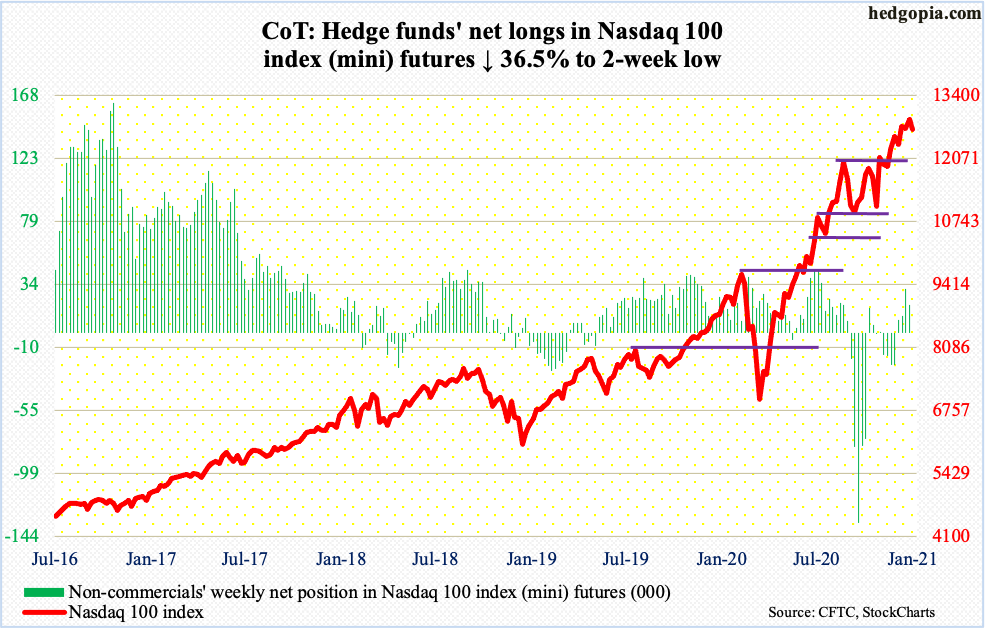
After rallying 11 percent in November, the Nasdaq 100 (NDX) added another 5.1 percent in December. For all of 2020, it shot up 47.6 percent and 90.3 percent from the low of last March. Unreal!
The index has been able to put up this kind of performance even though there was a shift from growth to value beginning early November. It was not until December 1 the Nasdaq 100 surpassed its prior high from September 2. The S&P 500 (SPX), in contract, did so on November 9. Be that as it may, as they say, price is the final arbiter.
Monday was nasty, with the index down 1.5 percent, although it was down as much as 2.7 percent at one time, so some dip-buying did occur. There is room for the daily to continue lower. Selling will accelerate once the index (12694.67) loses 12200-12300.
Russell 2000 mini-index: Currently net long 9.8k, down 7k. (IWM)
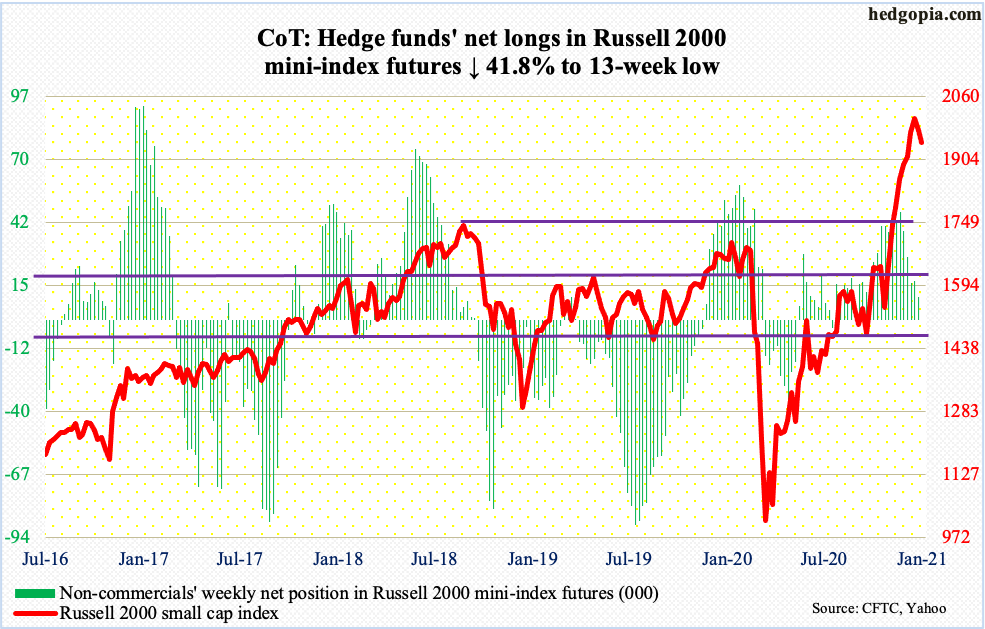
Last week, the Russell 2000 (1945.91) shed 1.5 percent. This was a first down week in nine; the small cap index began to wobble as early as Monday when it posted a new high of 2026.24 which bulls were unable to hang on to (more on this here).
Leading up to this, the Russell 2000 more than doubled since March, going vertical after bottoming at 1530s late October/early November. Last week’s action was further exacerbated yesterday, as it dropped another 1.5 percent, losing both the 10- and 20-day, which look ready to roll over.
Once 1930s give way, the next level of support lies at 1850s.
US Dollar Index: Currently net short 14.6k, down 318.
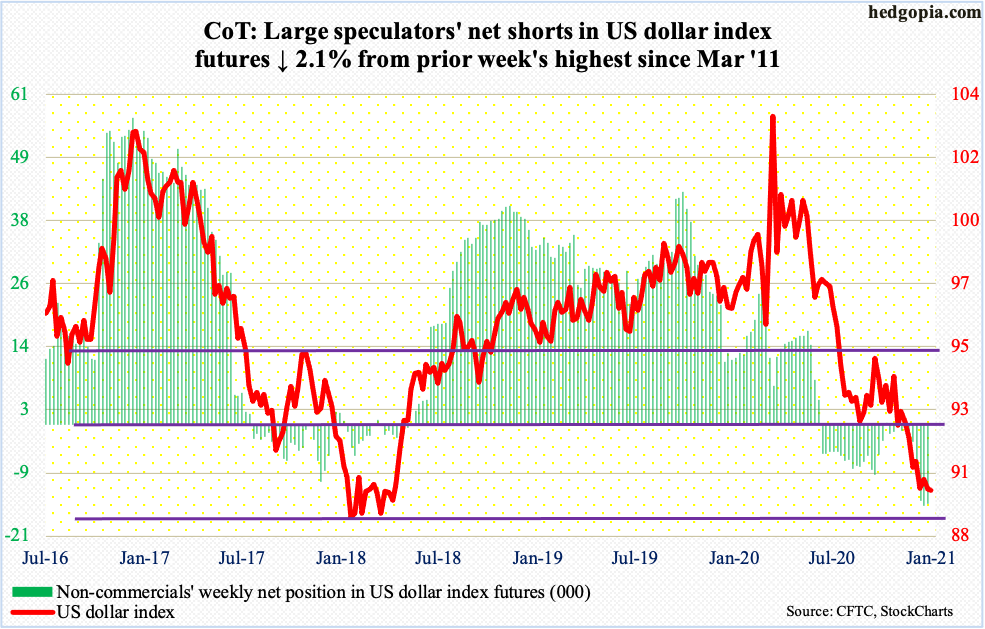
Monday’s intraday print of 89.39 was the lowest since April 2018; by the time the session was over, the US dollar index had rallied to 89.85, for a hammer reversal. A session before that – last Thursday –a potentially bullish engulfing candle formed. Horizontal support at 88-89 goes back to at least March 2004.
Last March, the dollar index touched 103.96, so obviously it has come down a lot. On its way here, it lost major support just north of 92 in late November. Bulls cannot afford to lose 88-89. If they succeed in putting their put down, nearest resistance lies at 90, followed by 90.50s.
VIX: Currently net short 98.6k, down 2.9k. (VIX)
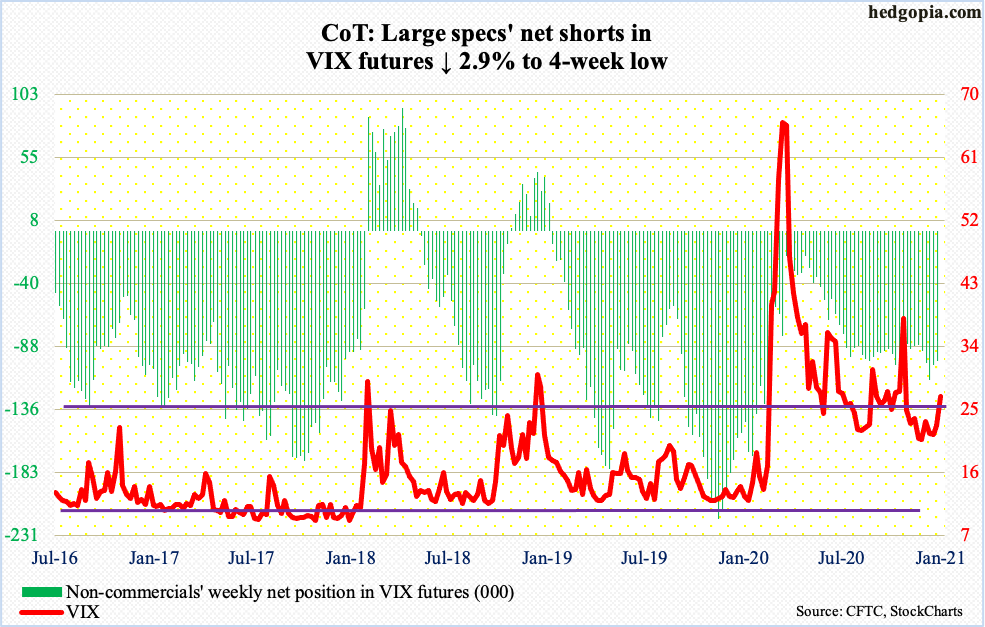
December was a month in which both VIX and the S&P 500 rallied, which does not happen often; on the 4th, VIX went sub-20 – 19.97 to be exact. The volatility index also tagged 19.51 in November. Other than that, 20 held, even as the S&P 500 kept making new highs, including yesterday, before rolling over.
Since that November low, VIX has made higher lows but kept getting rejected at mid-20s – until yesterday when the volatility index (26.97) added 4.22 points to also recapture the 50-day (25.13). Volatility is getting ready to perk up.
Thanks for reading!
This blog is not intended to be, nor shall it be construed as, investment advice. Neither the information nor any opinion expressed here constitutes an offer to buy or sell any security or ...
more

