

Image Source: Unsplash
USD/CAD

(Click on image to enlarge)
The US dollar bounced all over the place against the Canadian dollar during the course of the trading week, as it continued to experience a lot of volatility. However, there are a lot of problems with the Canadian economy.
At the same time, the market is likely to continue to see a lot of pressure to the upside for the greenback due to interest rates in America. With PMI numbers coming out hotter-than-anticipated on Friday, that only adds more of a charge into this pair to the upside.
Bitcoin

(Click on image to enlarge)
Bitcoin initially tried to rally during the course of the week and test the $67,000 level, only for it to then turn around and show signs of weakness. At all times, this is an asset that looks as if it is going to be noisy, especially after we have seen a 92% increase in the value of Bitcoin in just six weeks.
Since then, it has spent almost four months doing absolutely nothing. The market has been working off some of this froth, but as things stand right now, it looks like the $60,000 level underneath will continue to be a major support level that people will have to pay close attention to.
WTI Crude Oil

(Click on image to enlarge)
The crude oil market rallied rather significantly during the course of the trading week to eclipse the $80 level. At this point, the market is likely to continue to see a lot of buyers jump into this space as it is now breaking out above the crucial $80 level.
At this point, if crude oil can break above the top of the weekly candlestick, then I think it’s likely that the market could go looking to the $85 level. As things stand right now, I believe that any short-term pullback will continue to attract buyers.
DAX

(Click on image to enlarge)
The German index stabilized during the course of the week between the EUR18,000 level on the bottom, and the EUR18,250 level in the top. The candlestick itself is not overly impressive, but it does suggest that the space is currently stabilizing after the massive selloff during the previous week.
Because of this, if it can break above the EUR18,250 level, I believe this is a market that will truly take off to the upside and then go looking to the recent high levels again. Longer-term, it would not surprise me at all to see this market go looking to the EUR20,000 level.
If we were to see a break down below the EUR18,000 level, then we may see the market challenge the EUR17,750 level, an area that it had bounced from previously. Either way, I do favor the upside overall.
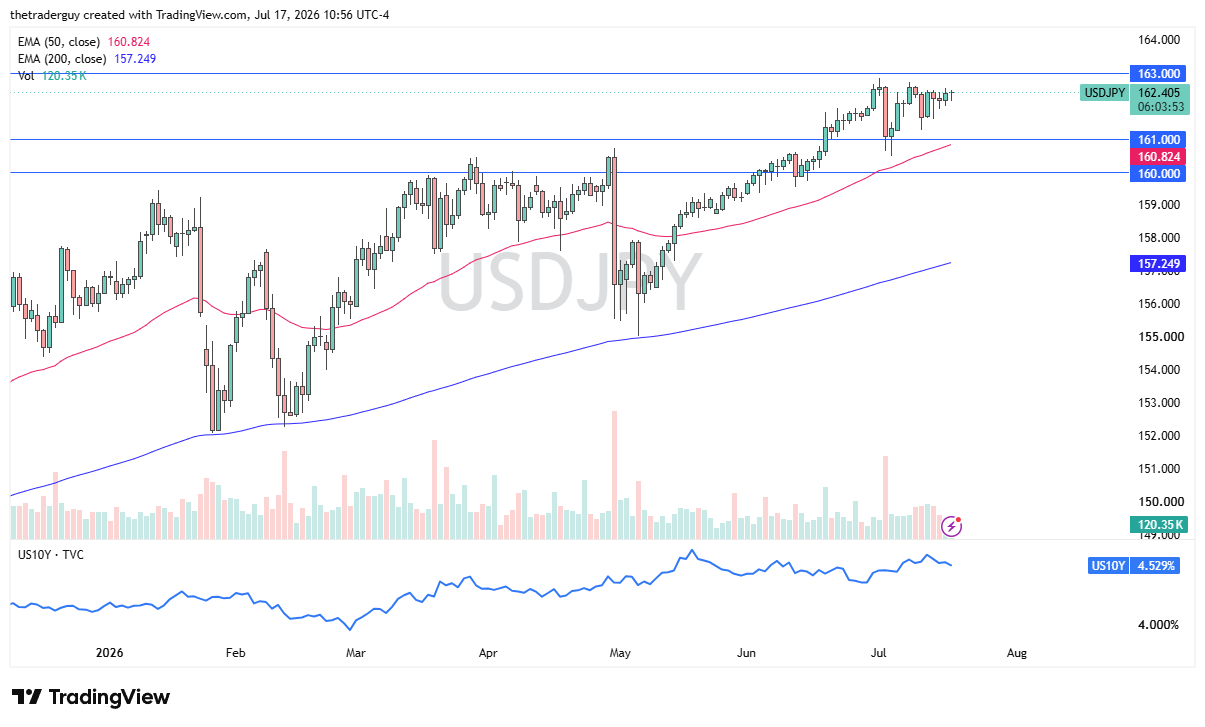
USD/JPY

(Click on image to enlarge)
The US dollar rallied rather significantly during the course of the week, as it looked to be trying everything it could to break above the crucial JPY160 level. This is an area that previously has been an important one, and it’s also where the Bank of Japan intervened.
A short-term pullback at this point in time could open up the possibility of seeing value hunters emerge on dips, and I would like to get involved on each and every short-term pullback with an eye on the JPY155 level underneath, which is a major support level.
EUR/USD

(Click on image to enlarge)
The euro rallied initially during the course of the trading week, but it then struggled with the 1.08 level. That’s an area that’s previously been important, and the euro has recently been hanging around the 1.07 level.
If it can break down below the bottom of the candlestick for the week, then I think the euro will continue to drift down to the 1.06 level. All things being equal, this is a market that I think will continue to be very choppy in general.
Silver

(Click on image to enlarge)
Silver moved all over the place during the trading week, as it broke above the $30 level at one point. I think the next couple of weeks will continue to be very important, and I will keep an eye on the $28.50 level underneath as a floor in the market. That being said, if the metal can break back above the $30 level, then it’s likely that the market could go looking to the $32 level above.
EUR/GBP

(Click on image to enlarge)
The euro witnessed an outsized week to the upside against the British pound, but I think it is still sorting out whether or not it can break above the 0.85 level. If the euro can break above the 0.85 level, then I believe that the market will continue to rally from there for a longer-term move. On the other hand, if we see a break down below the low of the past two weeks, such a move could bring in even more downward pressure.
More By This Author:
S&P 500 Forecast: Pressure From BuyersEUR/CHF Forecast: Bounces after SNB Rate Cuts
BTC/USD Forecast: Overhead Pressure


Comments
Log in or sign up to join the conversation.