
Pace Of US Home Price Acceleration May Be Getting Ready To Decelerate
US home prices continue to rise at an accelerating pace but may be in the process of cooling down. This can have implications for consumer sentiment, hence consumer spending.
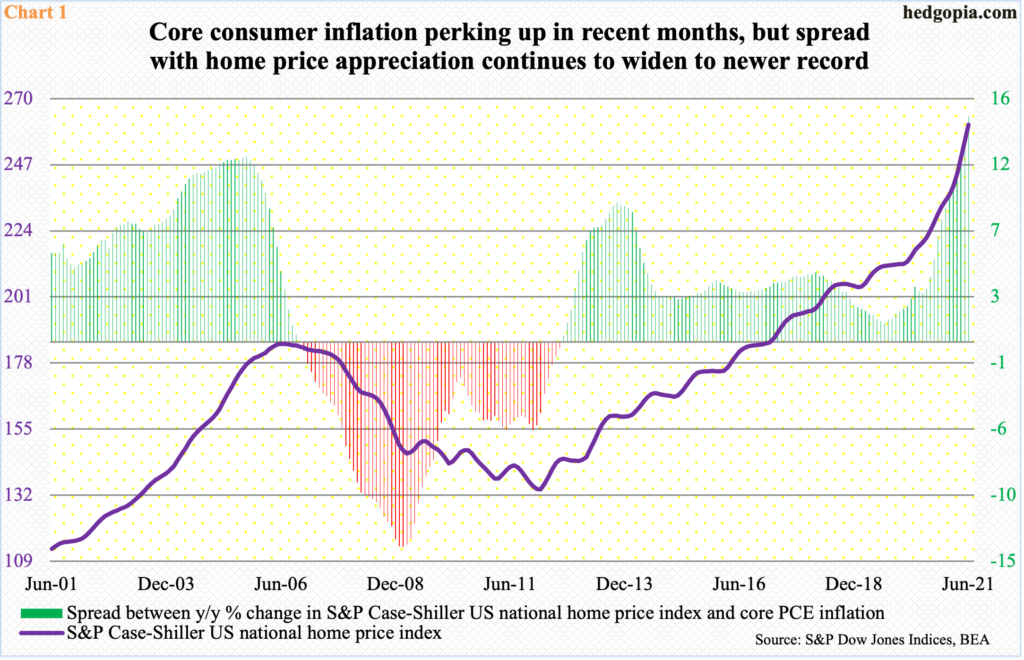
In June, home prices nationally shot up 18.6 percent year-over-year. This was the fastest pace of price rise in the S&P Case-Shiller Home Price Index’s 45-year history. Prices have been rising since May 2012 when the y/y change shifted from negative to positive, with an accelerating rate of change in the last 13 months.
In recent months, consumer inflation has perked up. In the 12 months to June, core PCE (personal consumption expenditures) inflation increased 3.58 percent, with July at 3.62 percent. A year ago, inflation rose at a subdued 1.3 percent clip. Nevertheless, home prices have been rising at such a rapid rate that inflation-adjusted price rise, too, set a record in June (Chart 1).
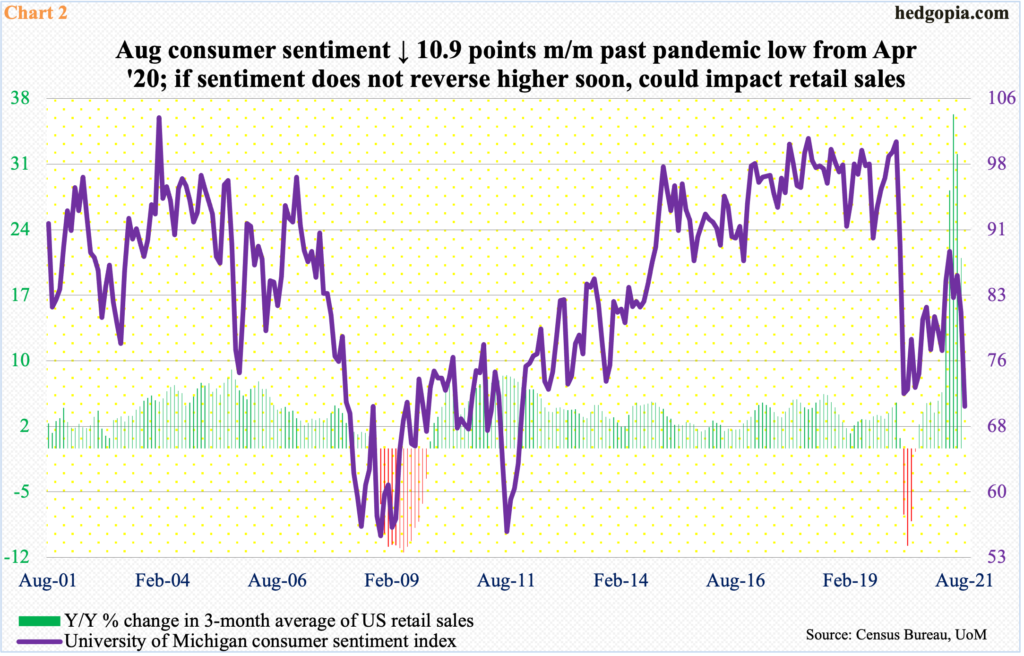
Concurrently, the University of Michigan’s Consumer Sentiment Index in June rose 2.6 points month-over-month to 85.5. Since then, sentiment has taken a hit, dropping 4.3 points in July to 81.2 and then another 10.9 points in August to 70.3, which is the lowest reading since December 2011 – obviously lower than the post-pandemic low of 71.8 from April last year (Chart 2).
The sudden tumble in sentiment comes amidst record job openings in a red-hot economy, which is essentially firing on all cylinders. It is possible the torrid pace of home price appreciation is beginning to cool down.
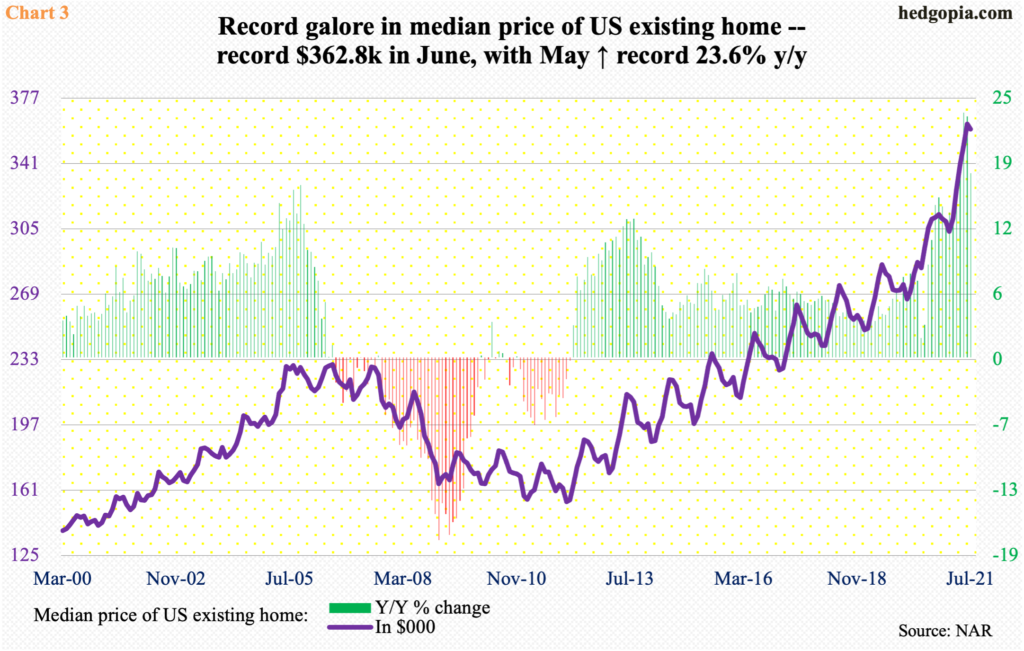
In July, the median price of an existing home dropped 0.8 percent m/m to $359,900, although y/y it rose 17.8 percent. The y/y pace decelerated in June and July, with May rising at a record 23.6 percent rate (Chart 3). June’s $362,800 was a record.
However, at $390,500 the median price of a new home continued to post a new high in July. Even here, the pace of rise decelerated, with July rising 18.4 percent y/y versus 22.1 percent in May.
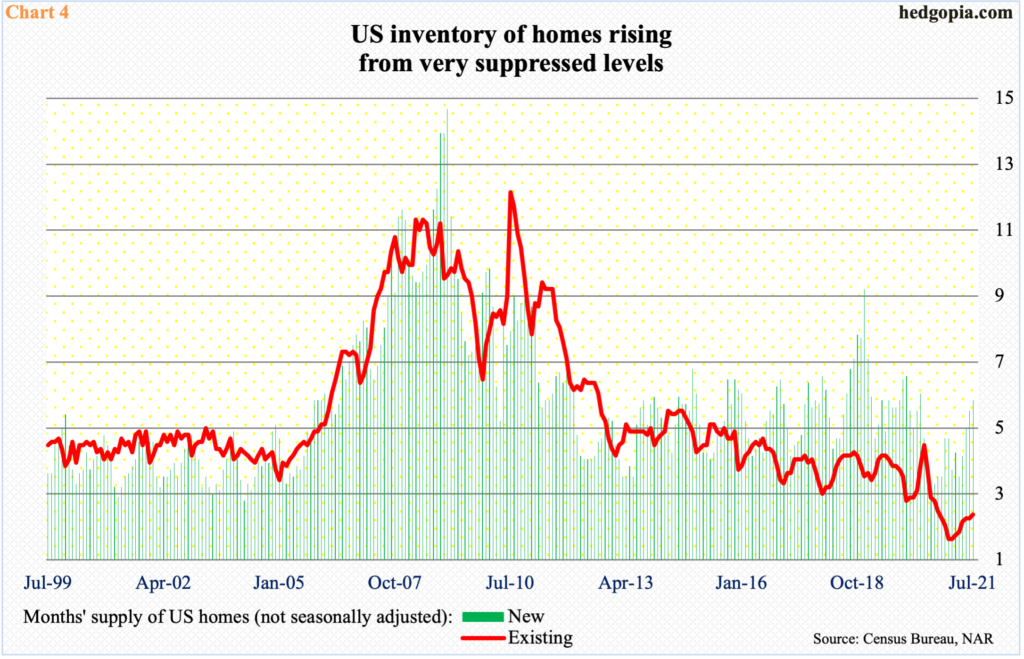
One reason for possible deceleration in home price growth is rising supply of homes.
In July, 1.32 million existing homes were available for sale, up from 1.03 million in January; months’ supply went up from 1.9 to 2.6. Similarly, 368,000 new homes were for sale in July, up from 283,000 in August last year; months’ supply rose from 3.4 in July last year to 5.9 in July this year (Chart 4).
Granted the inventory of homes is rising from very suppressed levels, but an increase is an increase. Tight supply was a major reason behind the unprecedented price appreciation, and a rising inventory should begin to gradually get reflected in prices – and in consumer spending/retail sales in due course (Chart 2).
The m/m drop in July in the median price of an existing home in all probability is the beginning of a trend.
Thanks for reading.
Disclaimer: This article is not intended to be, nor shall it be construed as investment advice. Neither the information nor any opinion expressed here constitutes an offer to buy or sell any ...
more

