
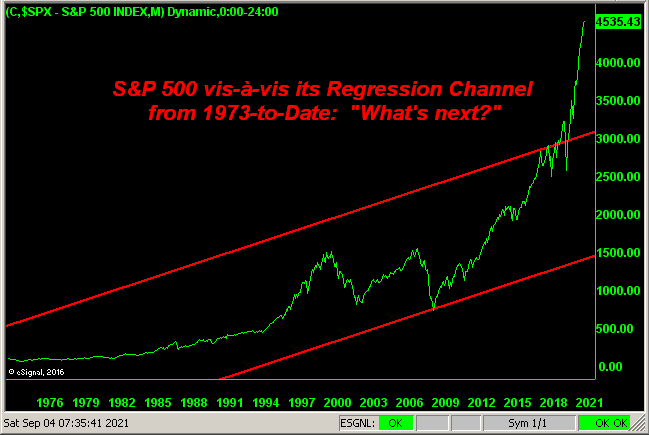
"Has the S&P crashed yet?" Such query has been woven into a bevy of recent editions of The Gold Update. As penned two missives back: "The stock market crash really is coming; we just don't know when": nobody does.

So stated, let's begin with the two most frightening graphics of the S&P we've ever seen since dear old Dad taught us how to read stock tables in the newspaper back in '64. For as labeled, the following two charts speak for themselves:

Barring the above two charts having elicited your suffering a myocardial infarction, should you still be standing we again ask: "Got Gold?"
As for the entitled notion of it being the S&P's "Crash Season", it goes without saying the September/October stint has a long history of being considered the stock market's most treacherous time of year. Thus given the S&P's runaway pricing (the only 17-month doubling on record), absurd lack of earnings ("live" P/E 51.0x), and minuscule yield (1.301%), right now seasonally is as good a time as any for it all to go wrong.
"So people sell their stocks, mmb, but then what can do they do with their money?"
First, Squire, is to acknowledge there'll be a difference between how much money they think they're going to have versus what they'll actually reap from selling into a bid-less market; (recall Oct '87, Jul '02, Sep & Oct & Nov '08, Mar '20, et alia). As a fine friend and Investors Roundtable member wrote to us just two weeks ago: "...I do agree that we will eventually arrive at stagflation and that a 50%-70% 'correction' is not unwarranted ... For now I am just following the yellow brick road of fantastic unrealized gains with my worthless buddies..."
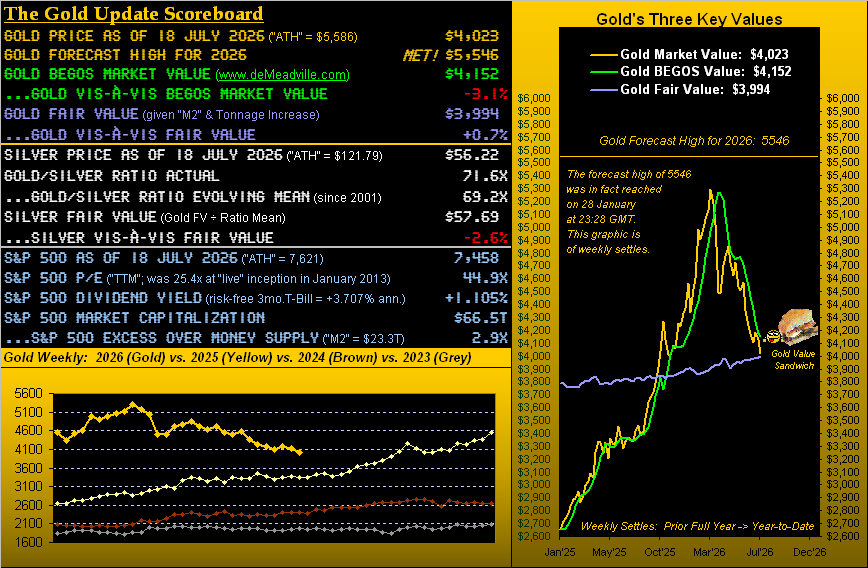
And second, Squire, is to endure the realization that next time 'round the S&P shan't then go zooming all the way back up, if for no other reason than everyone shall expect it to so do. Once burned ('01-'02), twice shy ('08-'09), thrice diced (where'd my dough go?) Reason enough to own Gold (GLD). (Oh wait, you still can!) Especially now at 1830 when our opening Scoreboard puts Gold's value today at 3899. Reason indeed.
Regardless, through the first eight months (plus three September trading days) of 2021, the economically-driven BEGOS Markets are "In" whilst the safe-haven markets are "Out":

(Aside: Hey California! How's that $6/gallon of watered-down gasoline workin' out for ya? Calculate liters-into-gallons, apply the cost of a €uro, and you've nearly caught up to the $7/gallon here. So you can cease with the snide "Gas costs twice as much in Europe" argument.)
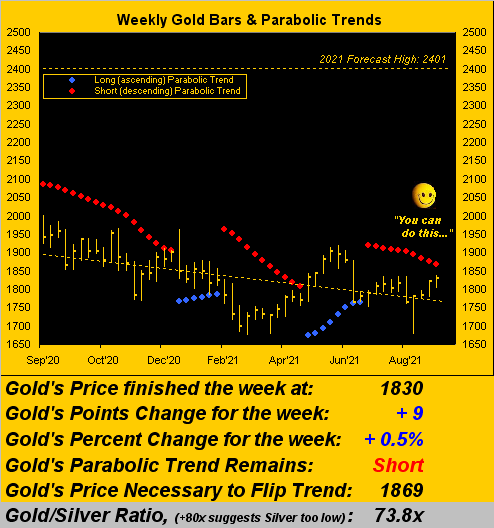
Meanwhile, enjoying a fourth consecutive weekly up-ride is Gold in settling yesterday (Friday) at 1830, leaving now well-behind the paper low-blow price (1678) suffered four weeks ago. Further, Gold is now but 39 points away from the rightmost parabolic Short trend red dot as we see here in the weekly bars. Given Gold's "expected weekly trading range" is 51 points, that red dot is ripe for the taking in the ensuing week, in turn opening the door back to the 1900s. And should there be an S&P scare, we'll see how Gold doth fare:
However year-over-year, there's been little to cheer as we turn to the percentage tracks of Gold and those of certain key metals equities. Therein at best we've Franco-Nevada (FNV) "unch", followed by Gold itself -6%, Newmont (NEM) -10%, the Global X Silver Miners exchange-traded fund (SIL) -14%, the VanEck Vectors Gold Miners exchange-traded fund (GDX) -19%, Pan American Silver (PAAS) -24%, and Agnico Eagle Mines (AEM) -27%. And yet by the Rule of Leverage, upon the day we find Gold with the least percentage increase of this bunch, price itself ought already be well on its way into uncharted territory:

Now as for the "it never actually was red-hot" StateSide economy, this past week's set of 16 incoming metrics were all over map. Notably to the better were August's ADP Employment gains, Hourly (inflationary) Earnings and lower Unemployment Rate, along with July's Construction Spending and reduced Trade Deficit. But notably to the worse were Labor's well-down read for August Payrolls, the declines for the Chicago Purchasing Managers Institute, Institute for Supply Management Services and the Conference Board's Consumer Confidence readings, whilst July's Factory Orders increased at but one-fourth the pace for June. Thus here's the all-over-the-map Baro:

Notwithstanding to where this all leads, Federal Reserve Chairman Powell keeps minds at ease in maintaining that the current inflationary stint is "transitory" en route to reverting to the Bank's 2% target, but should that not occur, heck, the target can simply be raised. Ok. But not to worry, because there'll still be "free" stuff, as (per the words of Dow Jones Newswires) "Democrats are counting on money from tougher tax enforcement to fund their agenda." But upon that not working out, you can consider moving to Japan where resigning Prime Minister Yoshihide "You Should Hide" Suga's successor may well be an economic stimulus presser. To reprise Welsh football commentator Toby Charles, "Ohhh 'tis all happening there!"
And happening here as we go 'round the horn across the last 21 trading days for all eight components of BEGOS, save for Copper (JJC), every linear regression grey trendline is in ascent as is basically true for their baby blue dots of trend consistency, (with the notion of "Crash Season" nonetheless in the balance):

As to the 10-day Market Profiles for the precious metals, similar to what we saw a week ago, the present prices (white lines) for Gold on the left and for Silver (SLV) on the right are near the top of their respective stacks, with volume support levels as noted:

'Course it being month's end, (plus the wee nub for September's wend), here we've Gold's Structure by the monthly bars from a decade ago-to-date. And as to our 2021 forecast high for 2401, yes, 'tis getting a bit late; but with the potential of "it all going wrong" in the year's balance, 'tis still on the plate:

We began with the S&P, let's thus end with it (pun intended) with this from our "Did You Know? Dept." Wary that "Crash Season" can happen -- and barring "The When" -- ultimately will, did you know that across the past 20 years the average percentage change from the S&P's September high to its October low is -8.2%? In such vacuum, we'd see the S&P (today 4535) move down to 4163. More realistically however, to further "correct" to the top of the regression channel (3215) per the first of those two frightening S&P charts would be a correction of -29%. Is that out of range historically for a September-October stint? No. (See 1987 & 2008). And today's extremes are far more so than back then. Thus it remains merely about "The When". So, again, don't get caught oversold: save your wealth with some Gold!

Cheers!
...m...


Comments
Log in or sign up to join the conversation.