
Oversold Condition
Current Position of the Market
SPX: Long-term trend – Final long-term phase on the way? How much longer, is the question.
Intermediate trend –We have started a correction of intermediate nature.
Analysis of the short-term trend is done on a daily basis with the help of hourly charts. It is an important adjunct to the analysis of daily and weekly charts which discusses the course of longer market trends.
Market Overview
After several weeks of distribution at its recent high, the bottom dropped out and was followed by a 200-point decline in the SPX in about a week’s time. The decline found support at the bottom trend line of a bullish channel which started to form at the December 2018 low of 2346.That and a grossly oversold short-term condition generated a counter-trend rally which has retraced slightly more than half the distance of what is probably only an initial selling wave. Since a fifty percent retracement of any move is fairly normal for a counter-trend rally, we should be looking for an end to the 100+-point rebound and a resumption of what should now be an intermediate downtrend.
Friday’s action showed sign of stalling but did not give a sell signal; consequently, a little more time may be required to achieve a complete reversal and a continuation of the initial down-phase.
Market Analysis (The following charts are courtesy of QChart)
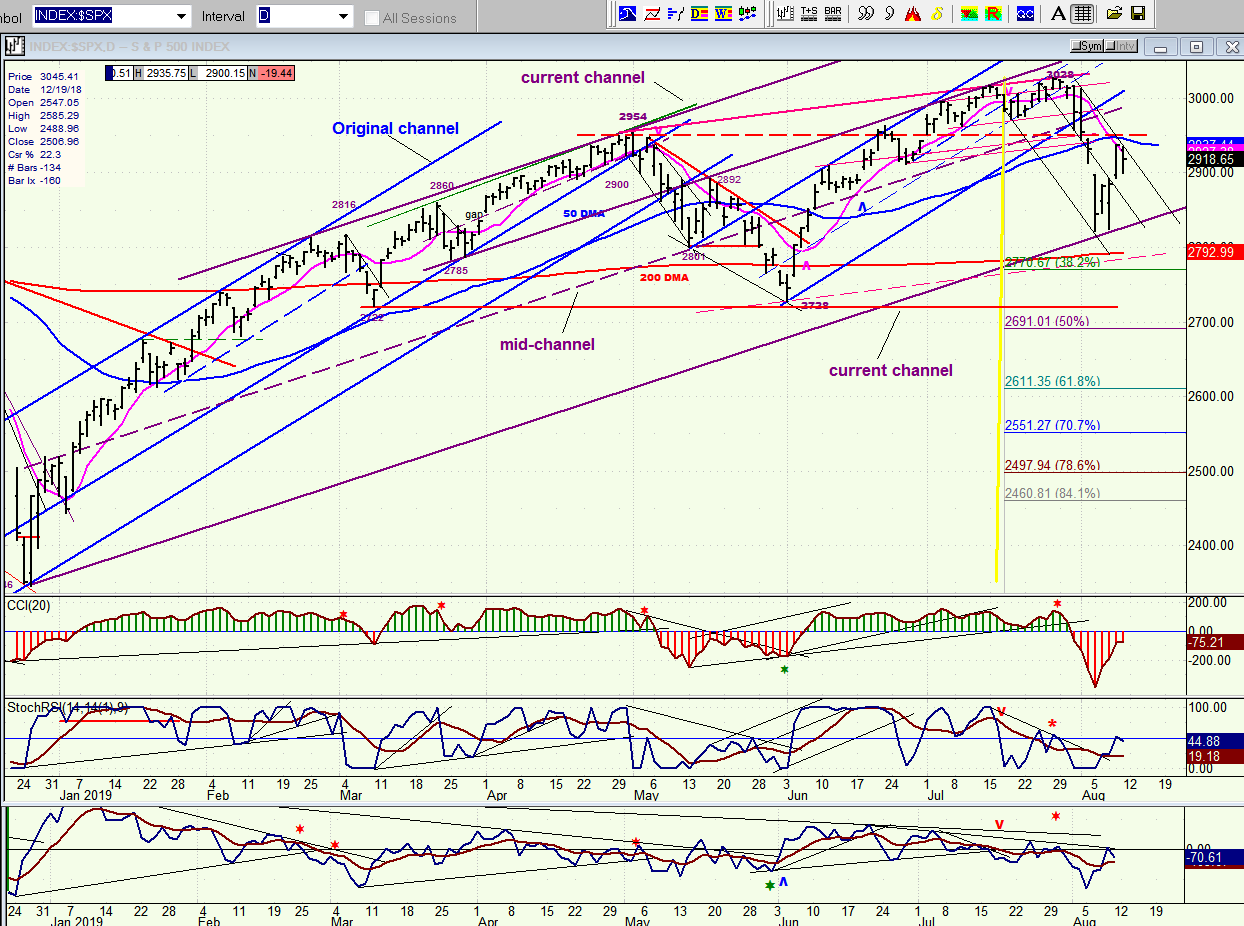
SPX daily chart
The decline from 3028 was sudden, engineered by two nearly simultaneous catalysts. It sliced through the small blue channel, the 50-dma, and came to rest on the bottom channel line of the larger channel, from which it staged a corrective rally back to just below the 50-dma.Considering thatthe rally also retraced a little more than 50% of last week’s downtrend, it is likely that this is merely a rally in a downtrend (more specifically the beginning of a downtrend) which is very close to ending and extending the initial decline to 2822 (2775 in the futures). It would be extremely unusual for the index to resume its long-term uptrend immediately after such a massive selling wave. At the very least, a re-test of the channel bottom should be expected and, more realistically, expectations should be for the channel line to fail to contain prices on the next decline.
The main rationale for continued weakness is that important cycle lows are still ahead, at least until about mid-September. Also, market leaders such as TRAN, IWM and XBD have all given weekly sell signals. SPX cannot be said to have done so conclusively, but it would be expected to follow the former and not resist their lead. The index did give a strong daily sell signal which was not reversed by last week’s rebound. If my evaluation is correct, by the end of next week, the decline will have resumed.
(Click on image to enlarge)
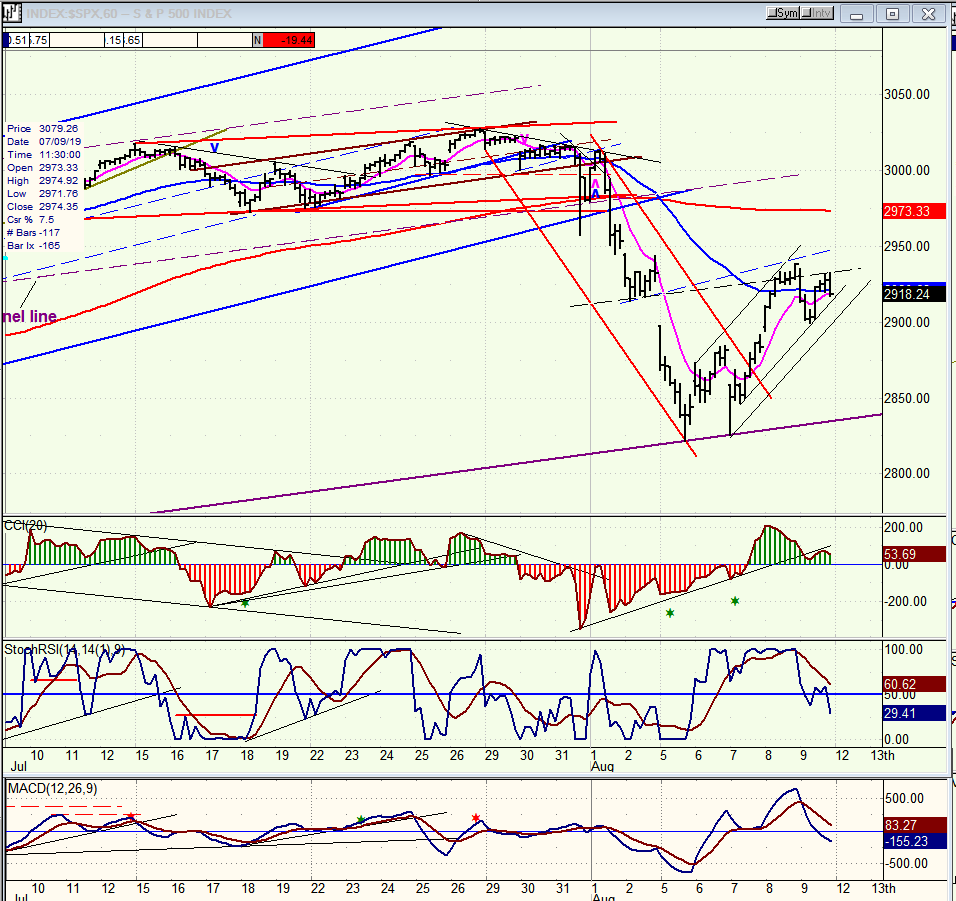
SPX hourly chart
The rally which started at the channel line came in two phases. The first phase was very short, and was quickly followed by a retest-off the channel line. After a normal retracement of a little more than half of the initial decline, the index ran into some resistance caused by the hourly 50ma and a couple of parallels to the master trend lines which are shaping the larger correction. Friday’s decline found support near the bottom of the small recovery channel and bounced, but could not quite make it to the previous short-term top. That puts the near-term trend in limbo! It has already turned down, but has not been able to completely resume the downtrend. All three oscillators have reversed, but only the lower two have turned negative. The top one will have to join them before a short-term sell signal has been given. In the meantime, a little more distribution could form in the vicinity of Friday’s close.
(Click on image to enlarge)
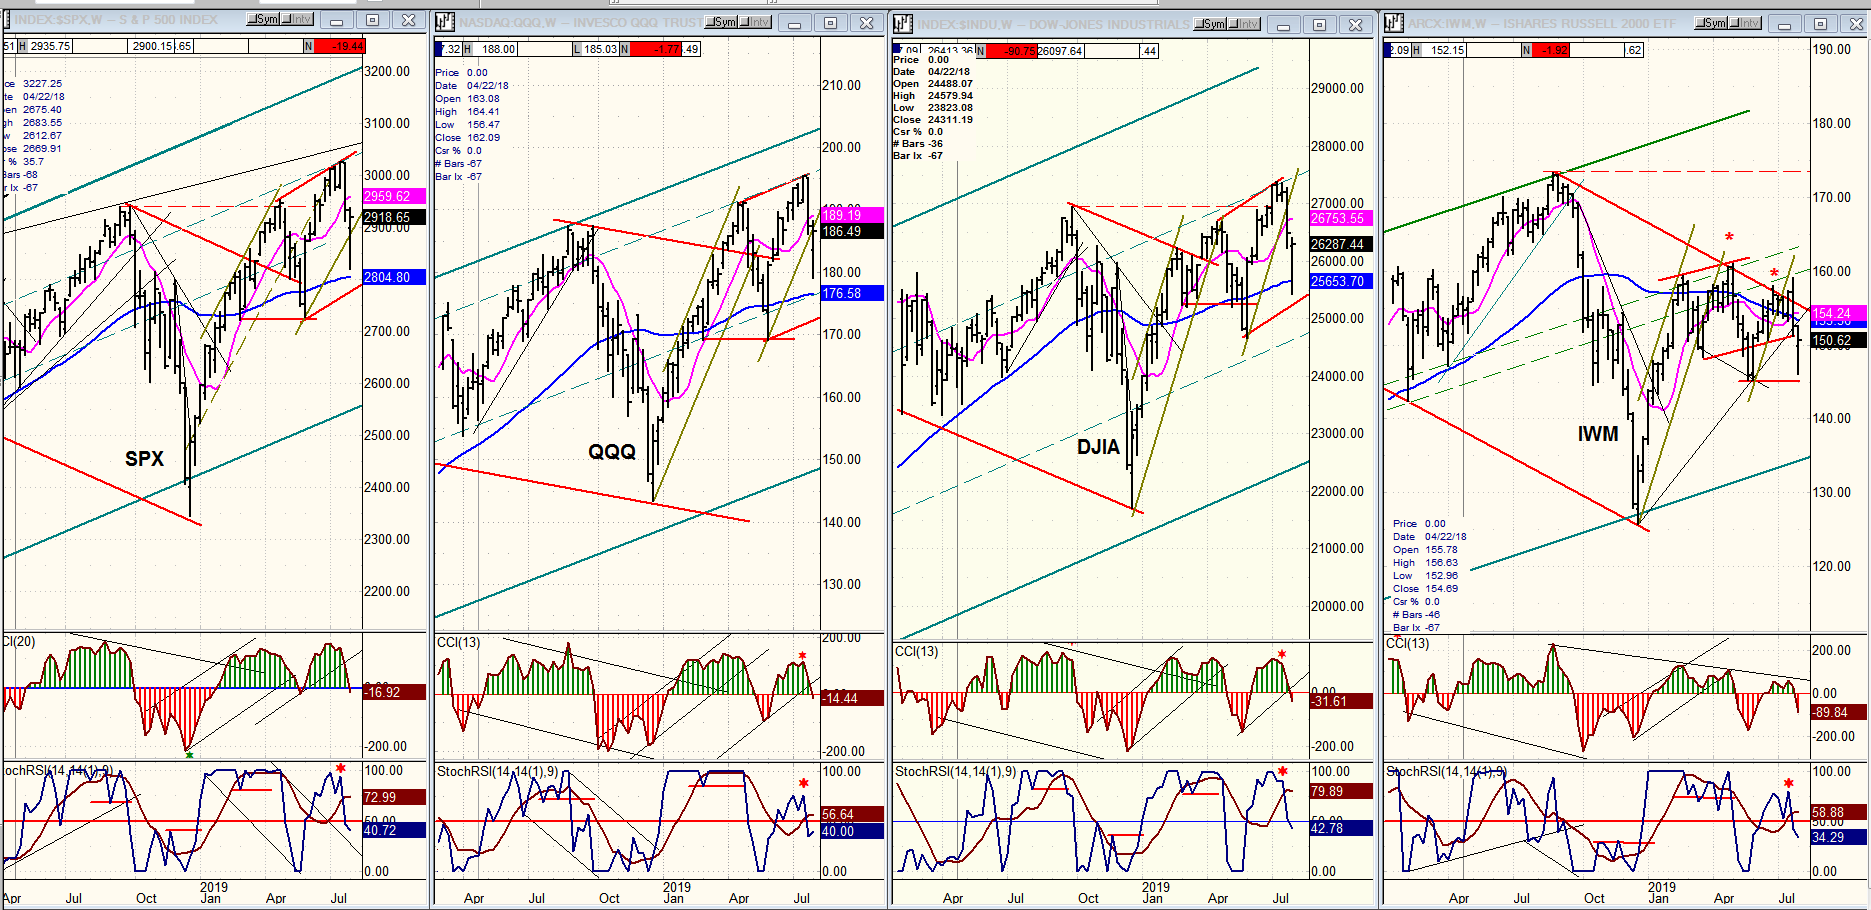
QQQ, SPX, DJIA, IWM (weekly)
It’s become pretty obvious that, after indulging the benchmark indexes in their desire to briefly make new highs, IWM has said “enough!” -- and has started to lead them into another downtrend; but not before broadcasting its intention with some severe negative divergence. Of the four charts shown below, it is the only one which has given a sell signal at the oscillator level. It is also the only one to have again fallen below its 50-wk MA. By now, IWM should have convinced us that it does lead the market and that, until it reverses direction, more weakness lies ahead.
(Click on image to enlarge)
UUP (dollar ETF) daily
UUP remains in a long-term uptrend which recently duplicated its January 2017 high. Understandably, this caused some profit-taking which so far is only very minor in scope. If the index can turn its top oscillator negative, it will signal that more selling is taking place. Even so, any correction at this time should be limited to the bottom of the blue channel, and perhaps not occur before a retest of the high has been made.
(Click on image to enlarge)

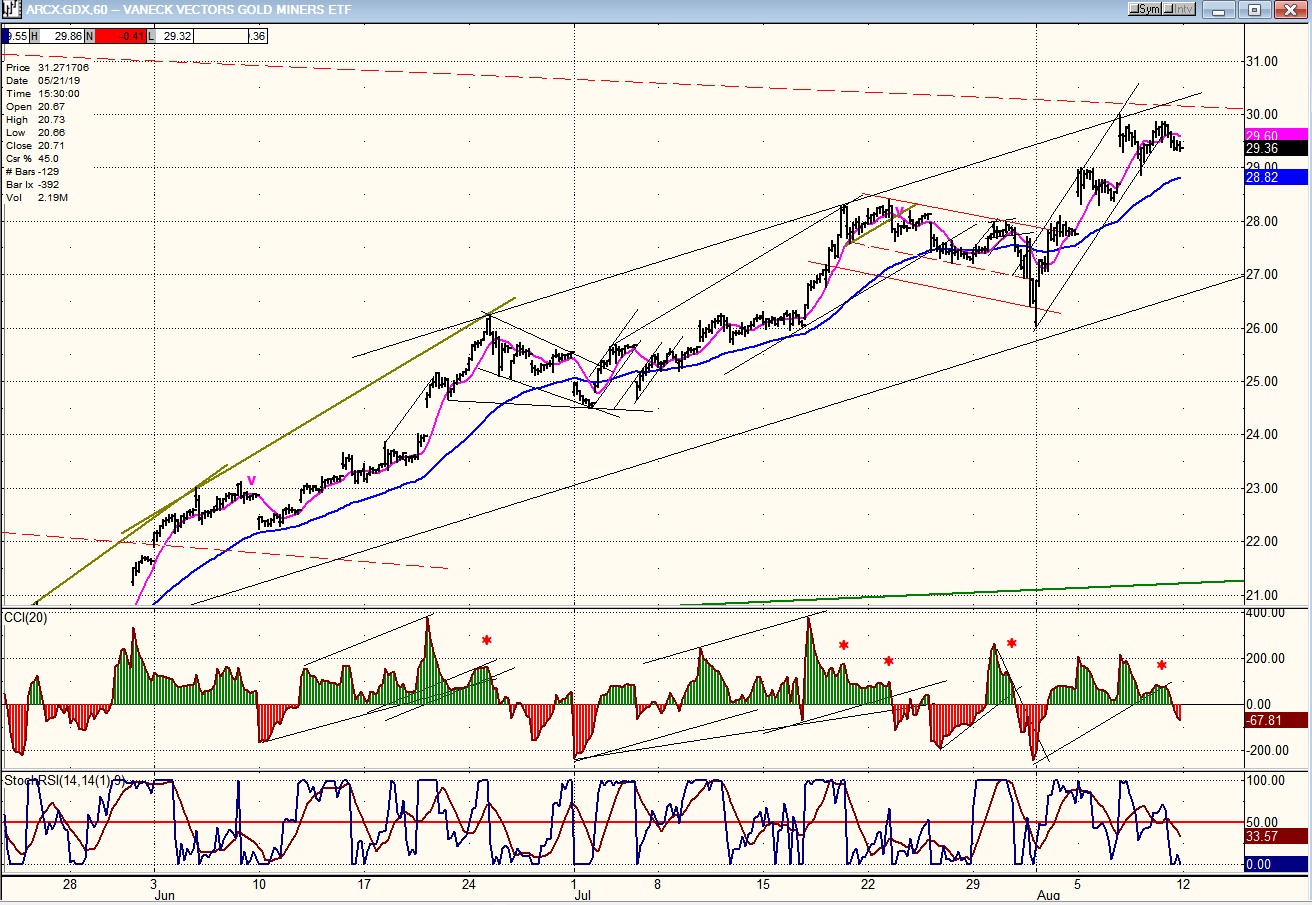
GDX (Gold miners ETF) hourly
I am using the hourly chart to display the ground covered by GDX since it broke out of its base. It consists of a well-behaved series of advances, followed by brief consolidations and then a higher high. The whole process has created a bullish channel with the last upward thrust bringing the index to the top of the channel. The last move also consisted of 5 small waves with a little climactic thrust at the end of the fifth which created what is probably an exhaustion gap which could put a temporary end to the entire uptrend. The pull-back has created a sell signal in the oscillators, but this is an hourly chart, so it may only cause a brief pull-back followed by another test of the high. If it cannot make a new high on the next try, it is likely that GDX will settle into a consolidation of its break-out wave which could take a few weeks to complete.
(Click on image to enlarge)
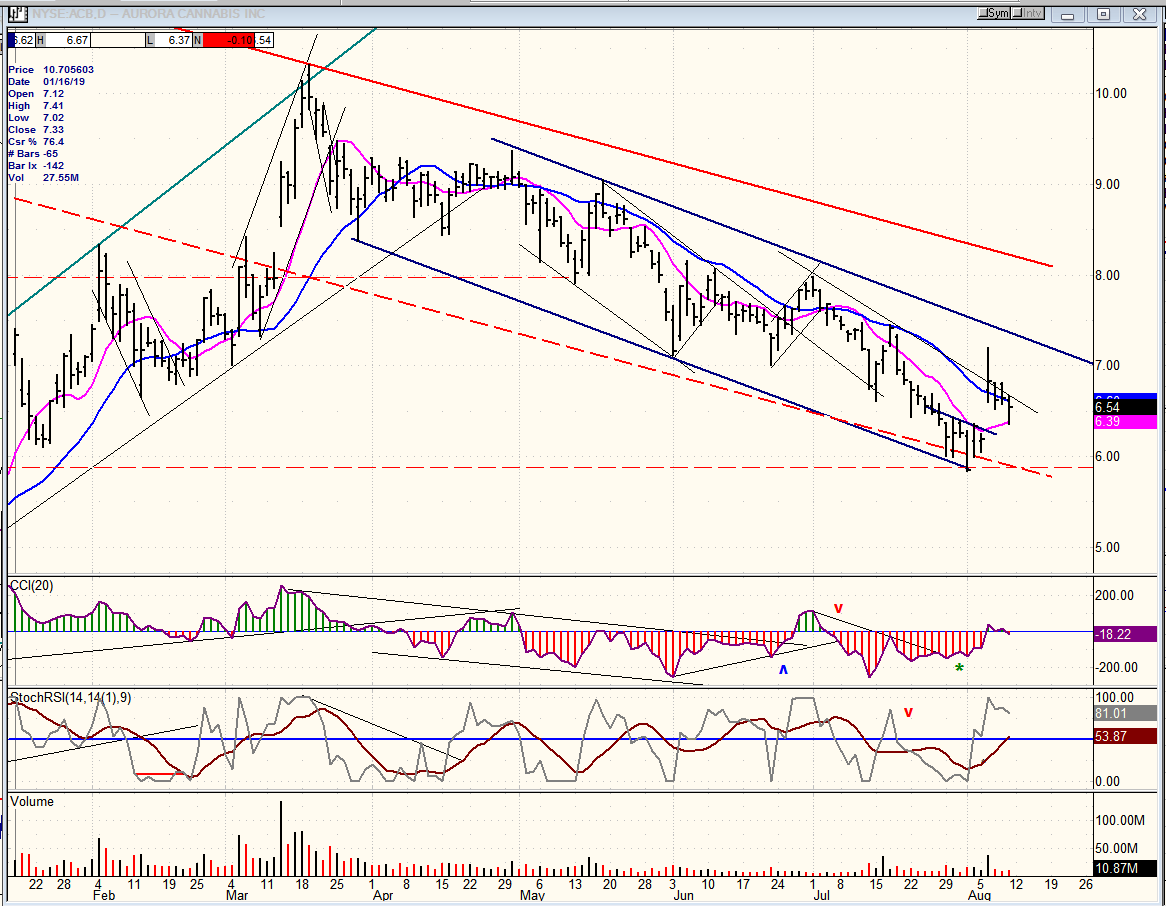
ACB (Aurora Cannabis) daily
Aurora came to the junction of two bottom channel lines which provided support and caused a bounce. There could be a little additional move higher to the top of the smaller channel, but it is unlikely to do much more until a base has been formed on the P&F chart.
(Click on image to enlarge)
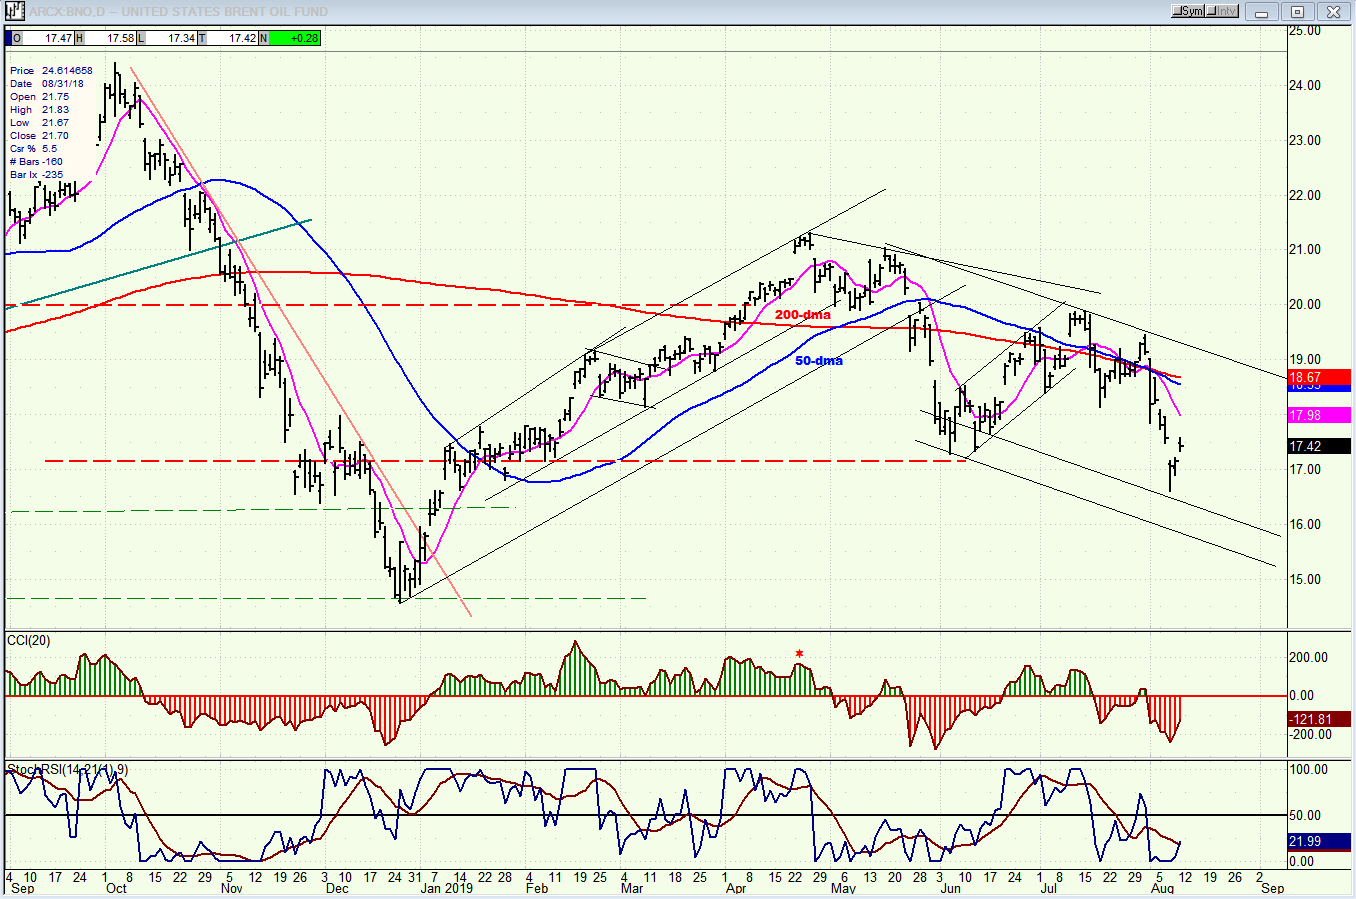
BNO (U.S. Brent oil fund) daily
BNO is following the prescribed path that became apparent when it broke below all three moving averages. It has now formed a bearish channel and will remain in a bearish trend as long as it remains within it.
(Click on image to enlarge)
Summary
The first phase of the correction took the SPX down about two hundred points. It is currently rallying from an oversold condition and getting ready to start on the next phase of the decline.
Analysis of the short-term trend is done on a daily basis with the help of hourly charts. It is an important adjunct to the analysis of daily and weekly charts which discusses the course of ...
more

