
Overbought, But Not Beaten Down... Yet? Stormy Data Ahead
"In order to know where we're going, you need to know where you've been." This quote by Maya Angelou is no less important to investors as they look forward to another trading week. With this in mind, we are forced to recognize the S&P 500 has faltered for 2 consecutive weeks, losing .5% two weeks ago and working off overbought conditions last week by falling another 1 percent.
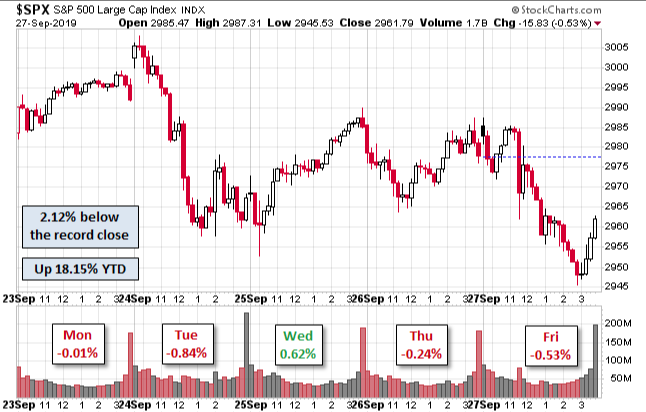
Even with 2 consecutive weekly losses, the S&P 500 is up roughly 18.5% for the year. Keep in mind, the index fell roughly 4.5% in 2018. Despite the YTD gains for the benchmark index, last year's Q4 market sell-off looms large in the minds of investors, whom have once again turned increasingly bearish. We saw last week's AAII survey which showed a drawdown in bullishness and a subsequent surge in bearishness. Over the weekend, Topdown Charts poll of fintwit (Twitter financial market participants) identified much the same trend as shown in the charts below:
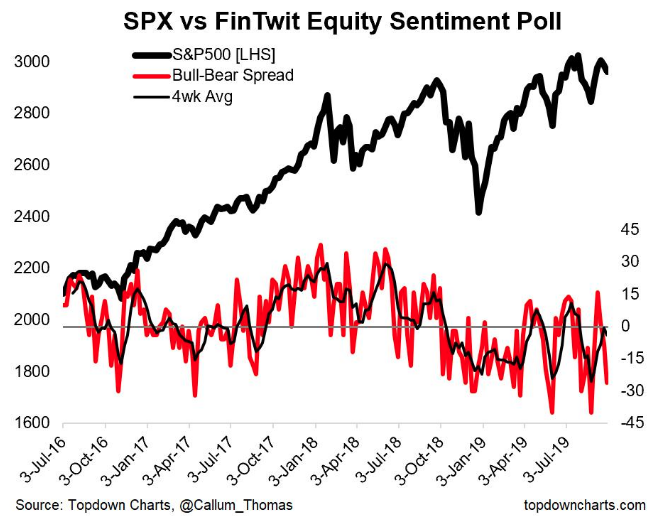
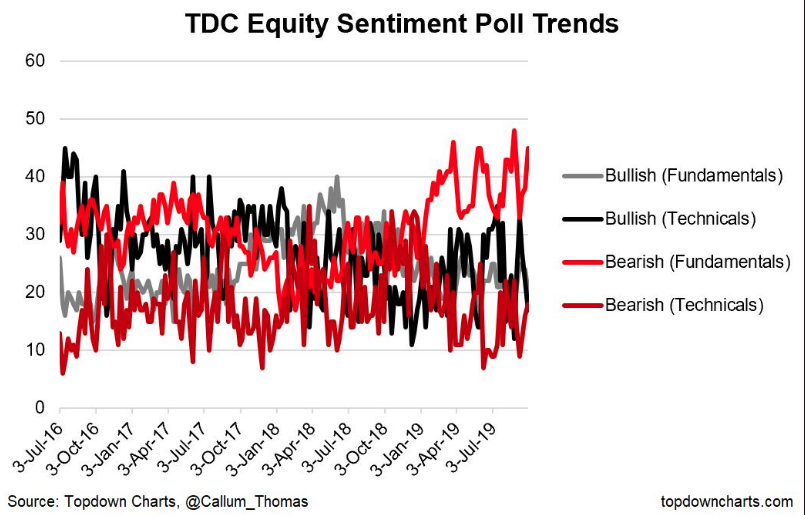
Surprisingly, there was a large uptick in bearishness from the weekly FinTwit sentiment survey: 63% bearish (mostly via fundamental 45% pts) 37% bullish. Nonetheless and while the bulls are seemingly awaiting the next batch of either geopolitical or economic headlines, Frank Cappelleri, chief market technician at Nomura Instinet, is here with a rather rosy outlook for the S&P 500 via his recent interview on Real Vision:
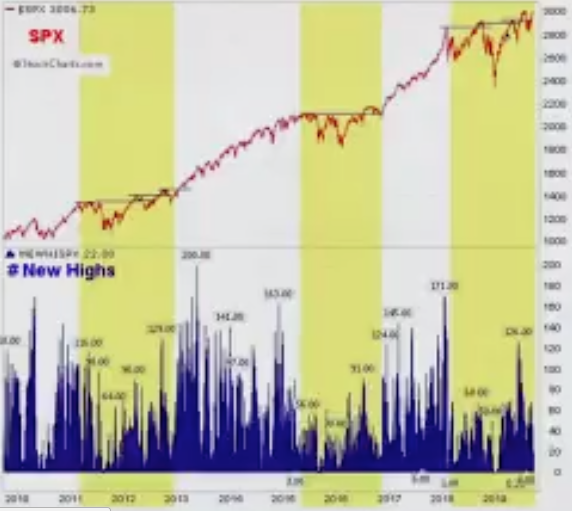
With the S&P 500 continuously bumping its head at resistance levels (in and around the 3,000 level), the index has failed to breakout from an elongated consolidation period. Cappelleri, however, identifies this is the same pattern we had seen from the benchmark index from 2011-2012, 2015-2016 and more recently in 2018-present. What often happens during these long consolidation patterns that prove to resist breakouts is the formation of "double tops".
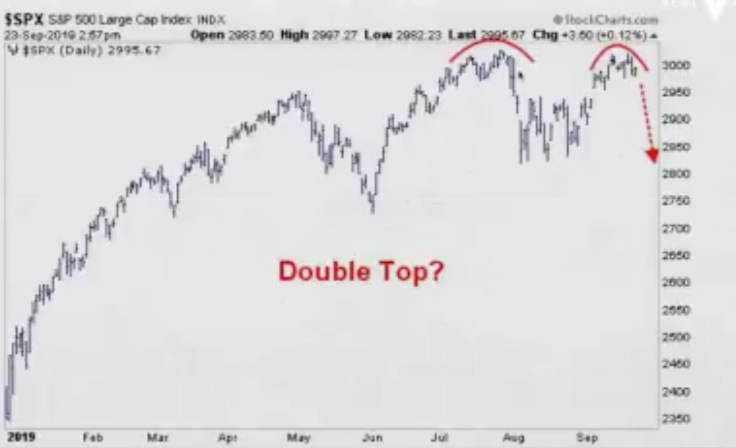
But Cappelleri points out that bearish patterns typically DO NOT play out. They appear and are quickly exonerated by bullish market activity, which is the natural tendency for the market to express. We should also point out that depending on the chart fractals, a double chart pattern like the one shown above is not a true representation of the many new highs achieved over the last 18 months and more recently in 2019. By definition, the more than 2 new highs negates the notion of a "double top" even though we can represent it to be so on a chart.
Most of the time, the market simply doesn't breakdown, but rather it expresses false breakdowns, which have already happened twice in 2019.
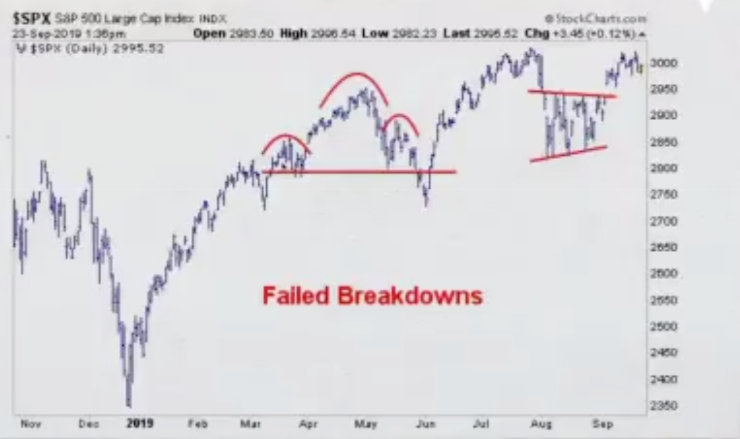
We saw the S&P 500 produce a head-and-shoulders pattern earlier this year in May, driven by geopolitical events. Finom Group (for who I am employed) declared the pattern formation a likely "buy the dip" opportunity for investors given the right shoulder was higher than the left shoulder, which typically resolves with the market moving higher. That false breakdown led the markets to new highs. From that false breakdown we witnessed yet another during the month of August, which found the index breaking out of a month-long consolidation period. Truth be told; bearish patterns typically don't play with the same frequency as bullish patterns, given that the market is driven by earnings, fundamentals over time.
Looking back to last week, however, what moved markets once again were geopolitical and domestic headlines. The market struggled for much of the trading week to discern the probabilities for a U.S. Presidential impeachment. With Congress moving forward and implementing a full-scale impeachment inquiry, President Donald Trump set off a firestorm of tweets and distracting narratives from the White House Administration concerning investment in China as well as China stock listings in the United States.
Neither offering from the White House Administration has reasonable probability of moving forward and become law or some type of regulation, but it was enough to turn a 100 point rally on the Dow into the red on Friday. Once again, headlines found the market down for 2 consecutive Friday's, when they were otherwise rallying at the end of the trading week.

The White House was said to be weighing some curbs on U.S. investments in China. The discussion includes possibly blocking all U.S. financial investments in Chinese companies, the source said. It’s in the preliminary stages and nothing has been decided, the source said. There’s also no time frame for their implementation, the source added. Restricting financial investments in Chinese entities would be meant to protect U.S. investors from excessive risk due to lack of regulatory supervision, the source said.
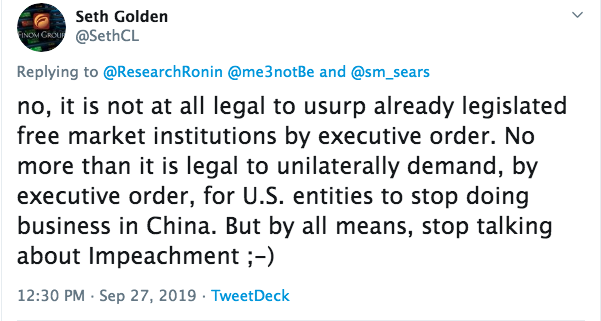
In Finom Group's weekly State of the Market video, I offer to subscribers that the headlines breaking on Friday were merely distraction tactics being used by the Administration. There's simply no reasonable way to implement the aforementioned policy being considered with any degree of free market notions that support the U.S. financial market system, nonetheless reasonable means for oversight. Unfortunately, however, investors aren't always able to align logic during a fast moving trading day. While I believe the aforementioned policy consideration has any merit to it and won't find the light of day, don't take our word for it...
If the White House were to go through with that move, “it would be an unmitigated disaster,” says Stephen Roach, senior fellow at Yale University and former chairman of Morgan Stanley Asia.
“Open access to each other’s markets [is] really important, especially with China likely to be the biggest consumer market in the world in the first half of this century."
Roach noted that the United States and China had been negotiating what’s known as a “bilateral investment treaty” for about 10 years before the trade war began in an effort to open “our markets to China and China’s markets to us.”
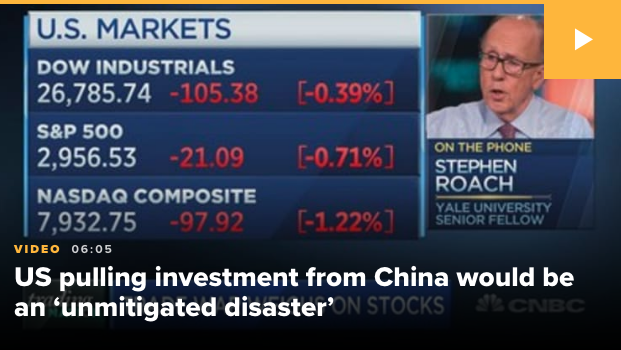
“We got really close, but now it’s been stalled out. We have bilateral investment treaties with 42 countries. China has them with 145. Free and open investment is the best way to enhance cross-border opportunities for multinational corporations, so we’re going the wrong way. This really would concern me if we were to make progress on it.”
Moreover, the nonsense offered regarding delisting Chinese entities from U.S. stock exchanges, well that has also already been walked back. A U.S. Treasury official said there are no current plans to stop Chinese companies from listing on U.S. exchanges, a day after a report that the Trump administration is discussing ways to limit U.S. investors’ portfolio flows into China.
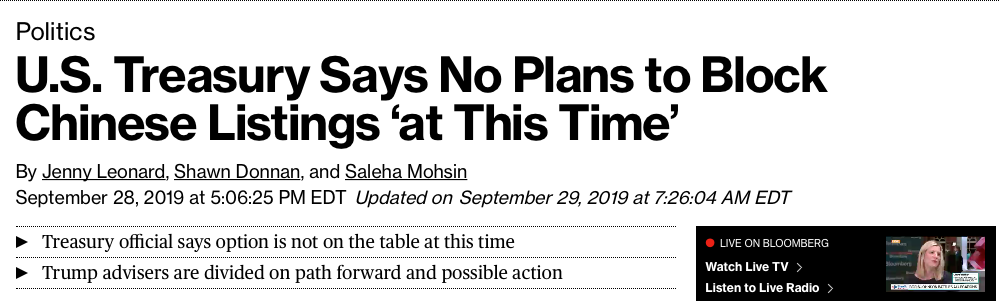
“The administration is not contemplating blocking Chinese companies from listing shares on U.S. stock exchanges at this time,” Treasury spokeswoman Monica Crowley said in an emailed statement on Saturday.
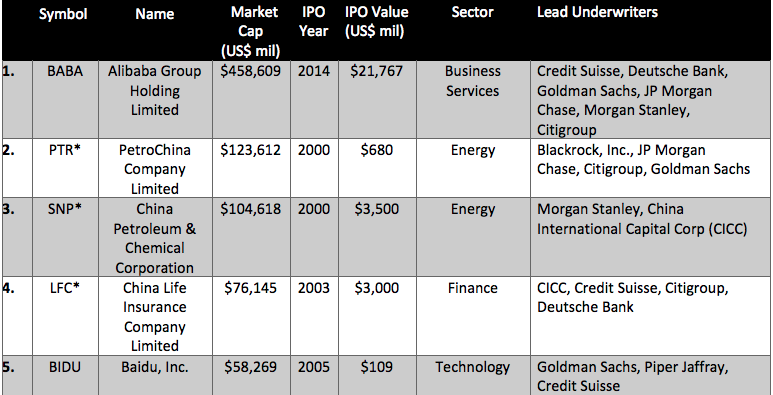
And in case you were wondering how many Chinese companies were listed on U.S. stock exchanges, all you have to do is go to the USCC site.

As of February 25, 2019, there were 156 Chinese companies listed on these U.S. exchanges with a total market capitalization of $1.2 trillion. Below are just a few Chinese companies noted:
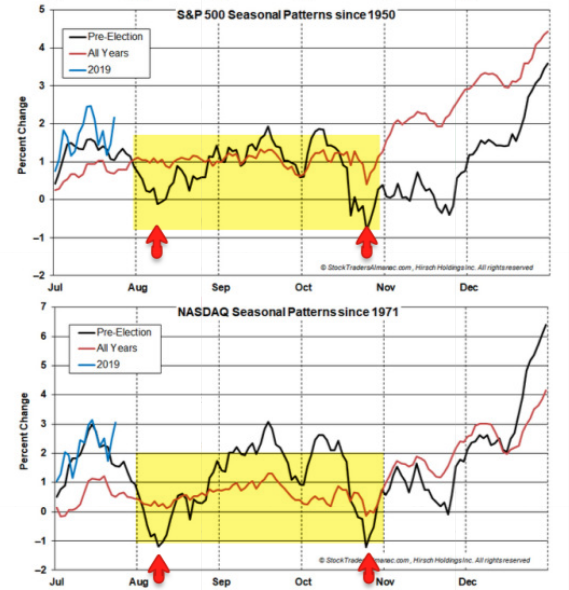
For the trading week ahead, investors will likely find it beneficial to expect more geopolitical noise ahead of the U.S./China trade negotiations set to take place around October 10th, as previously announced by both parties. With that being said, we also suggest investors resolve the geopolitical noise with strong long-term technicals that have previously been expressed in the S&P 500, which is simply working off overbought conditions. With the S&p 500 pulling back in the final trading week of September, seasonality has a more favorable setup for early October, even if not so favorable for the end of October, historically speaking.
Additionally, we remind traders and investors that there is still a gap the S&P 500 has the opportunity to fill near-term. This gap appears right around the 2,957 level as shown in the chart below:
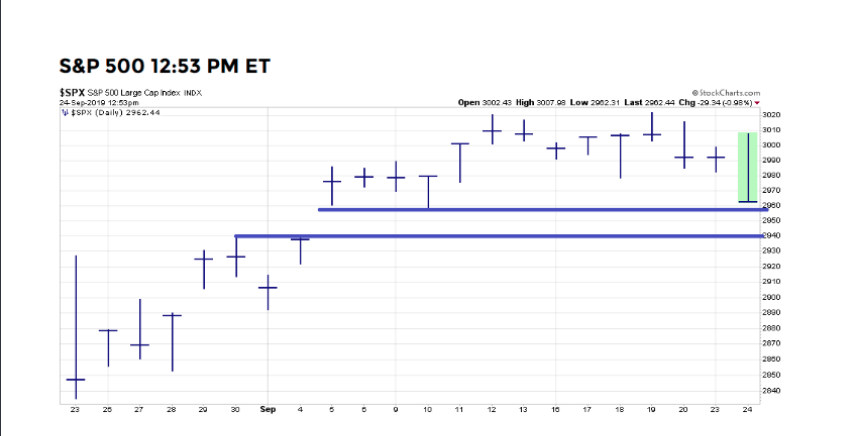
The gap would be filled if the S&P 500 dips down to 2,939. We'll need to be alert for this possibility in the coming trading week and expect it to be filled should certain headlines break that concern investors.
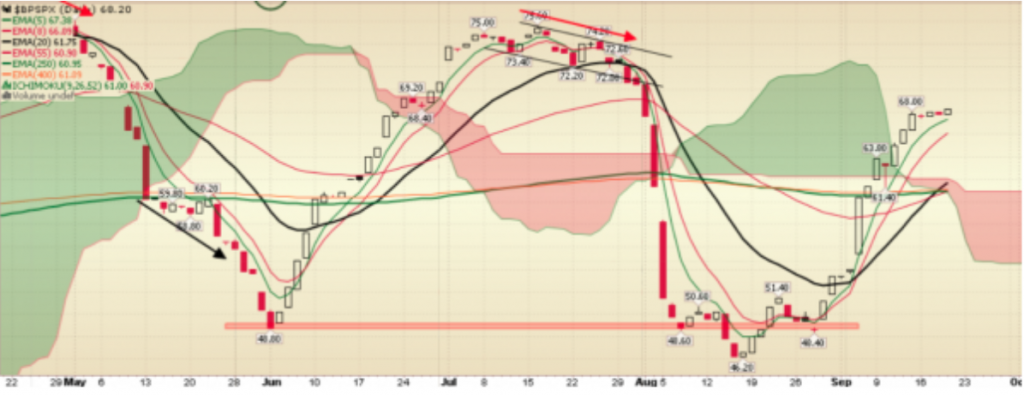
As noted earlier, the market is currently working off overbought conditions, for this reason, I would expect a number of market internals and/or breadth indicators to have weakened over the last two weeks. That is exactly what has occurred. Setting the expectation ahead of time is a good exercise for trader psyche. With that being said, the S&P 500 Bullish Percent Index (BPI) has declined after peaking last week. Recall from last week's Research Report, this is what the chart looked like:
The BPI topped out right around the 68 level. With markets falling more sharply last week than in the previous week, more individual stocks also fell, which produced a rounding top in the BPI that ultimately declined a bit last week. The BPI will now come into the current trading week at 64.80, as shown in the chart below:
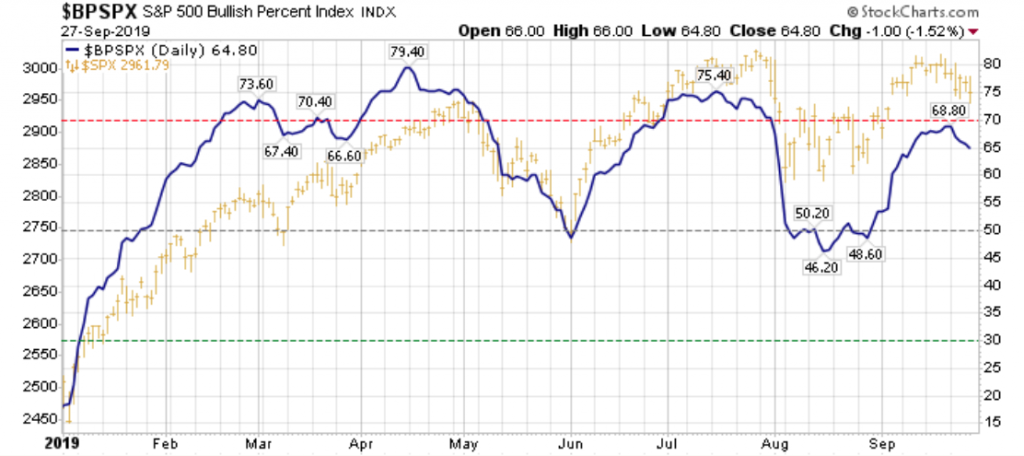
Undoubtedly, the BPI has weakened! Nonetheless, this was to be expected without a firm catalyst for the S&P 500 to breakout to new all-time highs. The index is simply setup for a breakout, but until a catalyst drives it toward and through this achievement/expectation, the market will likely grind back and forth in between support and resistance levels.
With the BPI spoken for, we also recognize that the number of stocks now trading above their 200-DMA has also come in a bit.
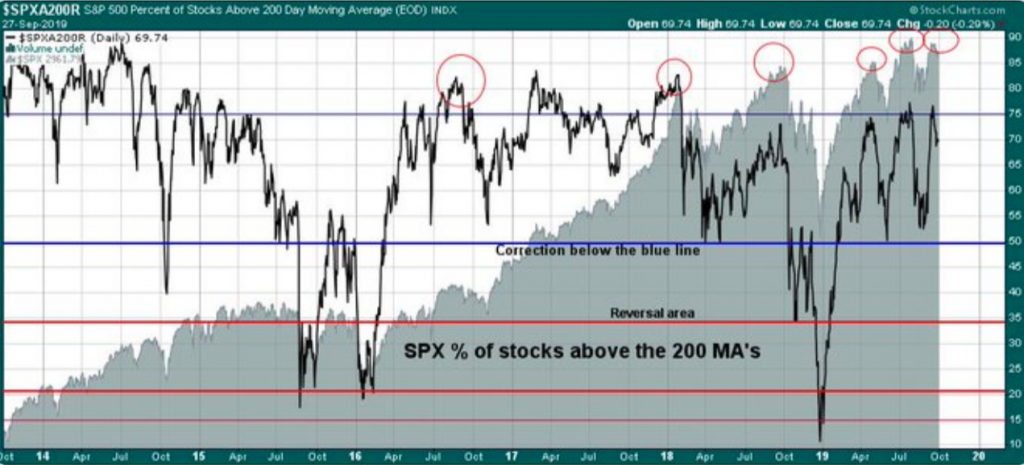
After hitting the 75% level, the number of issues trading above their 200-DMA has once again come up against resistance and declined. This marks the 3rd time this year that the 75% level has proven resistance and marked a subsequent pullback in the S&P 500 and breadth indicator.
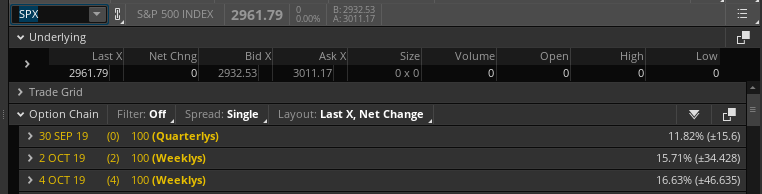
We've no doubt the week ahead will prove yet another exciting week for traders and investors alike. The S&P 500 weekly expected move has moved lower this week, oddly enough. Usually, a higher level of implied volatility (VIX) coincides with a greater weekly expected move. But with the VIX rising roughly 18% in the past week, the S&P 500 weekly expected move has declined from $48/points to roughly $47/points.
This week's economic data will likely prove more pressing for investors as the focus shifts to some of the more widely followed data. With that being said, the latest Chinese economic data proved to beat economists' estimates.
A private survey of China’s manufacturing activity, the Caixin/Markit factory Purchasing Managers’ Index (PMI), was 51.4 for September, the highest reading since February 2018. The latest data was much higher than the 50.2 that analysts polled by Reuters had expected and the 50.4 recorded in August.
The improvement in the Caixin/Markit survey was driven largely by firmer domestic demand, as foreign sales have continued to be dampened by the ongoing U.S.-China trade dispute, Caixin and IHS Markit said in a joint release.
“The trade conflicts between China and the U.S. had a notable impact on exports, production costs and confidence of enterprises,” said Zhengsheng Zhong, director of macroeconomic analysis at Caixin subsidiary CEBM Group.
"Central policymakers have recently been emphasizing the strong growth in the domestic market. Faster construction of infrastructure projects, better implementation of upgrading the industrial sector, and tax and fee cuts are likely to offset the influence of the subdued overseas demand and soften the downward pressure on China’s economic growth,” added Zhong.
The release of the private PMI survey followed the announcement of China’s official manufacturing PMI. The official data came in at 49.8 in September — the fifth straight month of contraction but slightly exceeding the 49.5 that analysts polled by Reuters had expected. The indicator was also 49.5 in August.
The Caixin PMI more closely tracks small, private manufacturers, while the official index focuses more on large, state-owned firms. The official PMI has a larger sample base, surveying 3,000 manufacturers nationwide, while Caixin polls 500 companies.
In the U.S., investors will be tuning in for the latest ISM manufacturing index reading that is due out Tuesday morning. The index dipped into contraction territory last month, spurring fears of a looming recession ahead.
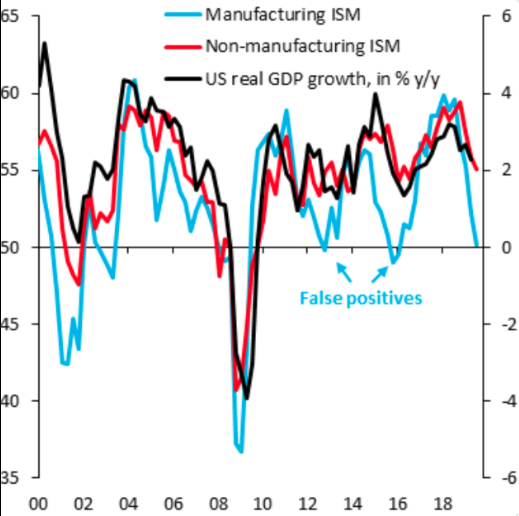
We've seen these misplaced fears in already twice during the longest expansion in history. Nonetheless, investor fears would likely dissipate should the index bounce from the recent low reading of 49.8 and back into expansion territory. I remain of the opinion that has a reasonably strong probability of occurring when the data is released on Tuesday, before the opening bell. In addition to the ISM manufacturing index data, the weekly data will culminate with the critically important Nonfarm Payroll report set for release on Friday at 8:30 a.m. EST.
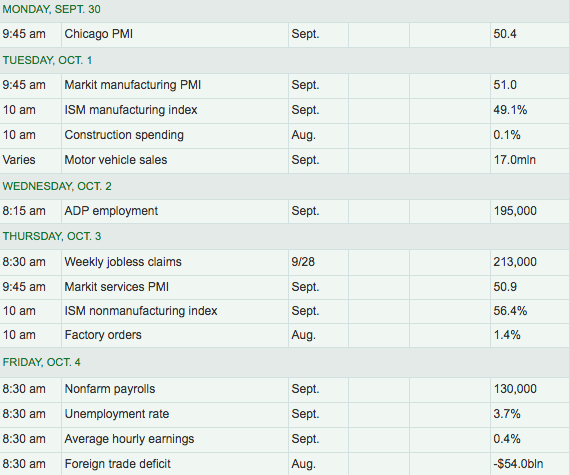
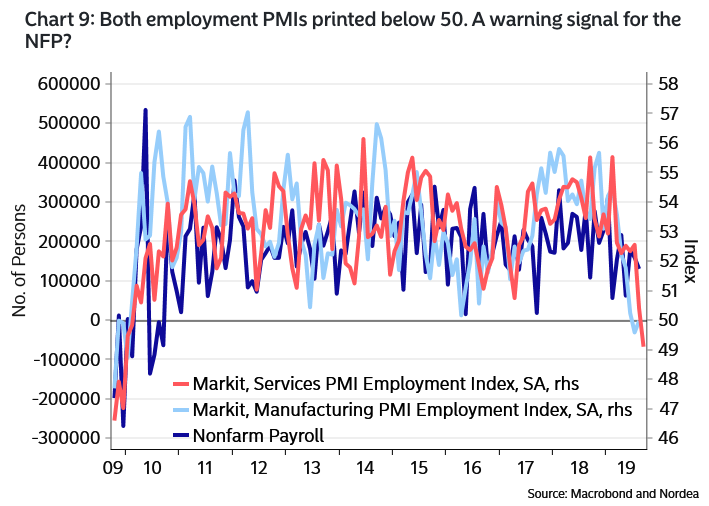
Investors will get a preview from Wednesday's release of the ADP private sector payroll report and have already some hints from regional manufacturing employment data, according to recent analysis performed by Nordea. (By the way, I do not find Nordea with proven analytics) Here is what Nordea recently offered, ahead of the NFP results Friday.
"Both of the employment sub-indices in the Manufacturing PMI and the Service PMI printed below 50 in the Markit Survey for the first time since 2009. If these employment PMIs have any decent prediction power on the NFP (we are far from convinced that they have), then a sub-50 reading should be seen as a hint of a negative monthly job number. If we get that, expect a big flight to quality!"
Bank of America Merrill Lynch has a more optimistic outlook for the NFP, but it's not found with extreme optimism for sure. BofAML expects Friday's Bureau of Labor Statistics (BLS) employment situation report to show that Nonfarm payrolls grew by 145,000 in September following an increase of 130k in August. For private payrolls which exclude government workers, they are looking for an increase of 125,000.
"Since the last employment report, labor market indicators on balance have been reading softer and portend to tepid hiring activity. … Elsewhere, we expect the unemployment rate to hold at 3.7% for the 4th consecutive month."
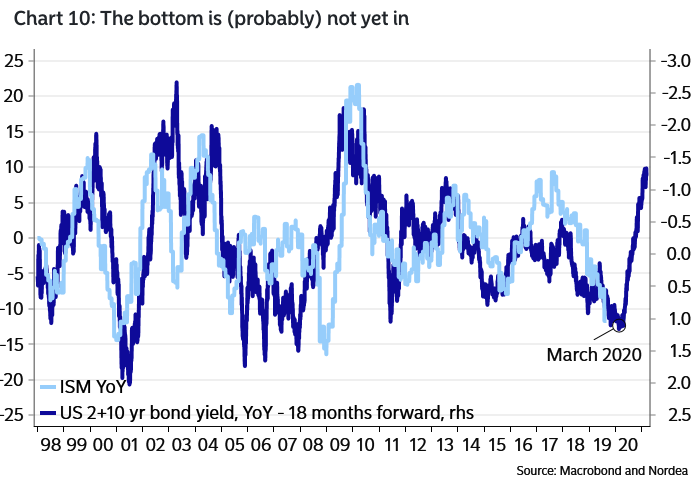
And since we discussed the upcoming ISM manufacturing data, let's also see what Nordea had to offer for this metric when reported:
"The ISM Manufacturing (Tuesday) index is trickier to judge. Regional surveys continue to paint a better picture than the ISM (on average), but forward-looking gauges such as lagged interest rates are hinting that the bottom is not yet in. Our weighted 2+10yr bond yield indicator hints of a bottom in ISM Manufacturing in March/April 2020. Lower, before higher. Consensus expects a rebound back to >50 territory."
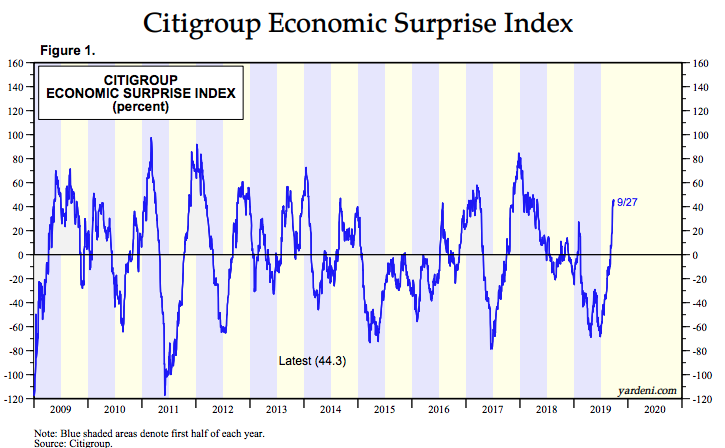
After some sanguine economic data through the late Spring and early Summer months, much of the economic data has since been better than most economists' forecasts. Housing data has strongly rebounded with rates moving lower and wages moving higher. And with the better economic data, the Citi Economic Surprise index has moved sharply into positive territory and to levels not seen since April of 2018.
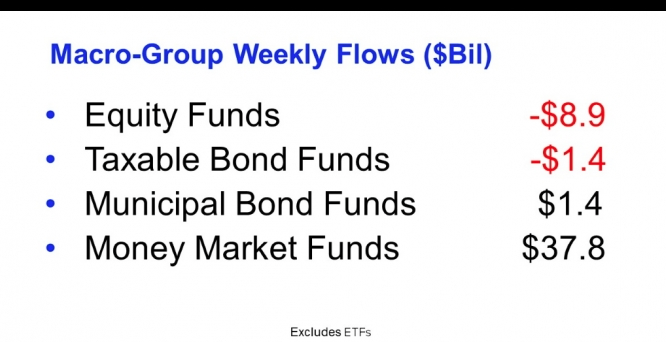
We'll have to wait and see how the data is revealed and how the market reacts this week, but in terms of the latest fund flow data, investors have been found to break a bullish streak in equity ETF fund flows. For the fourth week in a row, investors were overall net purchasers of fund assets (including those of conventional funds and ETFs), injecting $27.3 billion for Lipper’s fund-flows week ended September 25, 2019. Fund investors were net purchasers of money market funds (+$37.8 billion), municipal bond funds (+$1.6 billion), and taxable fixed income funds (+$427 million). However, they were net redeemers of equity funds (-$12.6 billion).
For the first week in four, equity ETFs witnessed net outflows, handing back $3.6 billion for the most recent fund-flows week. Authorized participants (APs) were net redeemers of domestic equity ETFs (-$2.8 billion) for the first week in five. Meanwhile, non-domestic equity ETFs witnessed net outflows for the second week running, handing back $884 million this past week. SPDR Gold ETF (GLD, +$2.0 billion) and SPDR S&P 500 ETF (SPY, +$1.3 billion) attracted the largest amounts of net new money of all individual equity ETFs. At the other end of the spectrum, iShares Core S&P 500 ETF (IVV, -$1.9 billion) experienced the largest individual net redemptions, and iShares Russell 2000 ETF (IWM, -$1.7 billion) suffered the second largest net redemptions of the week.
Again, everything we're seeing, be it with the market internals/breadth and/or fund flows, is actually what we'd like to see in order to work off the overbought conditions. And naturally, this is what we want to see heading into the heart of earnings season, which is expected once again to be subdued and found for an earnings decline on a YoY basis according to both Refinitiv and FactSet estimates.
According to Refinitiv, the estimated earnings growth rate for the S&P 500 for 19Q3 is -2.2 percent. If the energy sector is excluded, the growth rate improves to -0.3%. The S&P 500 expects to see share-weighted earnings of $340.8B in 19Q3, compared to share-weighted earnings of $348.4B (based on the year-ago earnings of the current 505 constituents) in 18Q3.
The FactSet forecast for Q3 2019 earnings is a decline of -3.7% and growth in revenues of 2.8 percent. Analysts see low single-digit earnings growth in the fourth quarter followed by high single-digit earnings growth for both Q1 2020 and Q2 2020.
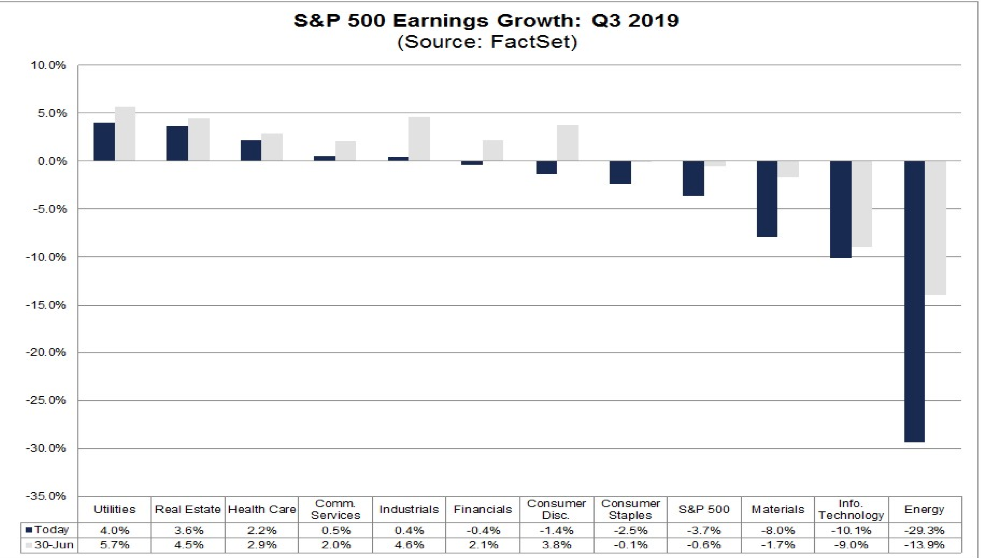
- For Q4 2019, analysts are projecting earnings growth of 2.9% and revenue growth of 3.6%.
- For CY 2019, analysts are projecting earnings growth of 1.3% and revenue growth of 4.1%.
- For Q1 2020, analysts are projecting earnings growth of 7.8% and revenue growth of 5.4%.
- For Q2 2020, analysts are projecting earnings growth of 9.0% and revenue growth of 6.3%.
- For CY 2020, analysts are projecting earnings growth of 10.6% and revenue growth of 5.6%.
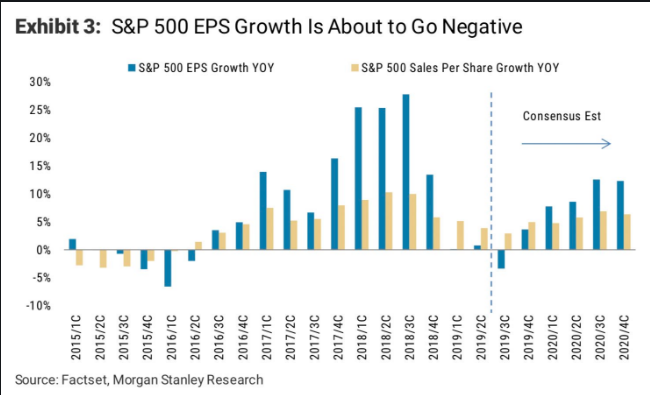
Morgan Stanley is none too happy with the earnings picture, but more importantly they continue to warn investors that estimates remain too high going forward. Even as such, the firm is becoming increasingly concerned that its S&P 500 outlook is not reflecting their EPS concerns.
"S&P earnings are poised to go negative, but the S&P “seems not to care either and so we have to acknowledge that perhaps the market knows something we do not.” Our earnings model still indicates “next year's consensus estimates of $181 are about 10% too high.”
"The S&P 500 itself is a defensive asset because of its high quality/growth bias, GAAP accounting, and good liquidity. .. Yet, even with this inherent advantage, the S&P 500 has delivered subpar returns over the past 12 months with increasing volatility.”
Rounding out today's Daily Market Dispatch I desire to reiterate that the gap fill mentioned previously, still bears a high probability of becoming fulfilled, absent an exogenous event such as a positive trade headline or tweet. Markets are still overbought ahead of earnings season and are currently trading at roughly 16.8 times forward 12-month looking estimates. While we do still anticipate PE expansion as rates remain lower for longer, the S&P 500 has yet to deliver on this expectation.
CNBC's Jim Cramer is of the opinion, that investors should expect a bit more downside before a more profound breakout occurs as well.
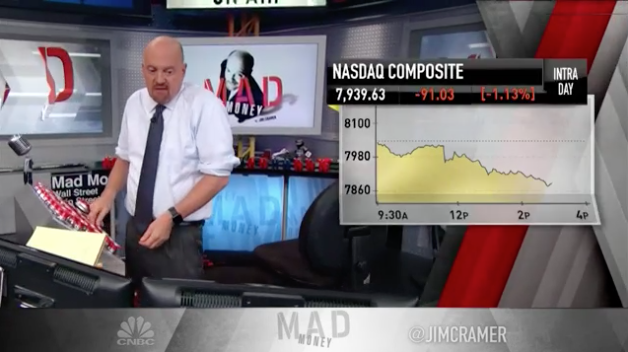
“I know it’s been rough, but last week this market was really overbought still, and when you’re overbought you tend to get hit with sell-offs … especially when we’re being flooded with shoddy IPO merchandise,” Cramer said. “I think we need some more downside before I’m really ready to get more positive.”
Cramer also weighed in with his expectation for the upcoming NFP report by saying the following to his Mad Money cohort...
“Employment’s been strong, but now everyone I know is acting like the good times stopped rolling,” Cramer said. “I don’t think that’s the case. I expect another good number, which may make it difficult for the Fed to give us another rate cut.”


