
Other +VE Divergences Take Shape As Markets Suffer 7th Weekly Drop
US stocks continued their downward trend last week. Both the S&P 500 and the Nasdaq suffered their seventh consecutive weekly drops.

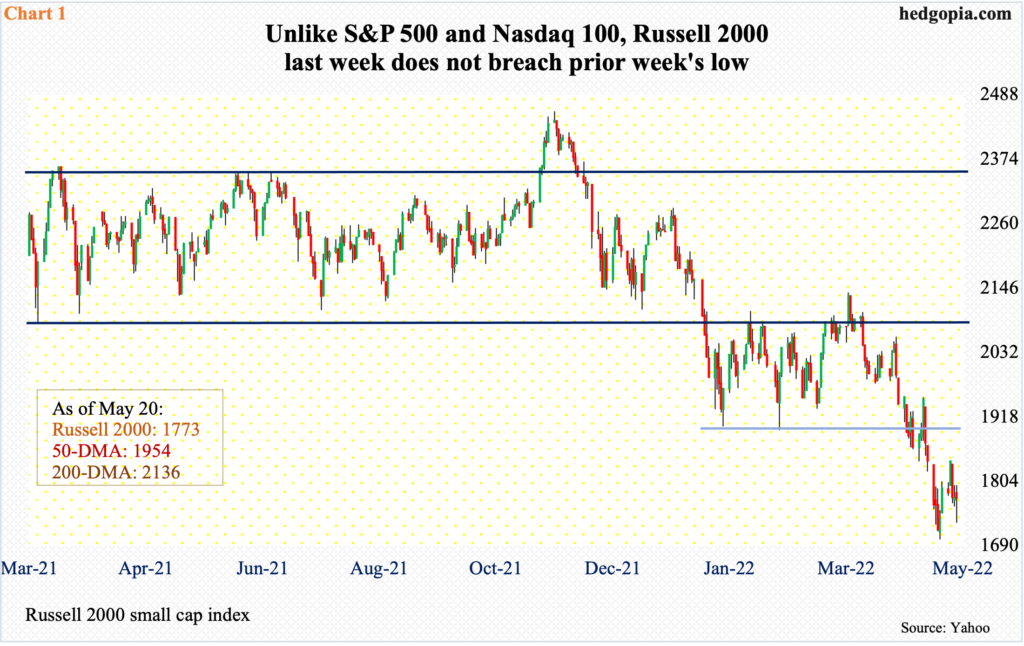
Amidst this also came flashes of hope. The Russell 2000 (IWM), a risk-on barometer, failed to make a lower low last week even as its two other peers breached prior week’s low. Concurrently, some other positive divergences have taken shape.
The bearish trend US equities have been under for the last several months continued last week.
Bulls have been gored.
The S&P 500 (SPX) peaked on January 4 at 4819. Last Friday, it ticked 3810, down 20.9 percent. The Nasdaq (QQQ) peaked on November 22 (2021) at 16212 and tumbled 31.9 percent through last Friday’s intraday low of 11036.
The Russell 2000 similarly plunged 30.8 percent between the November 8 (2021) high of 2459 and the May 12 low of 1701. For a change, the small cap index fared better last week – relatively, that is. It was down 1.1 percent, versus the S&P 500 down 3.1 percent and the Nasdaq down 3.8 percent.
Importantly, unlike the S&P 500 and the Nasdaq, no new low was made by the Russell 2000 last week (Chart 1). On the 12th, small-cap bulls defended 1700, which is where the Russell 2000 broke out of in November 2000. The breakout retest has held.
The next major resistance lies at 1900. For nearly four months now, the index (1773) has gone back and forth between 2080s and 1900, and for 10 months before that between 2080s and 2350s. Last week’s small-cap action could prove to be important.
Small-caps traditionally outperform when investor mood gravitates toward risk-on. It is early to definitively say this is what is going on but given the drubbing stocks have taken in recent months, it is possible.
Amidst this have emerged some positive divergences in tech land – as well as elsewhere.
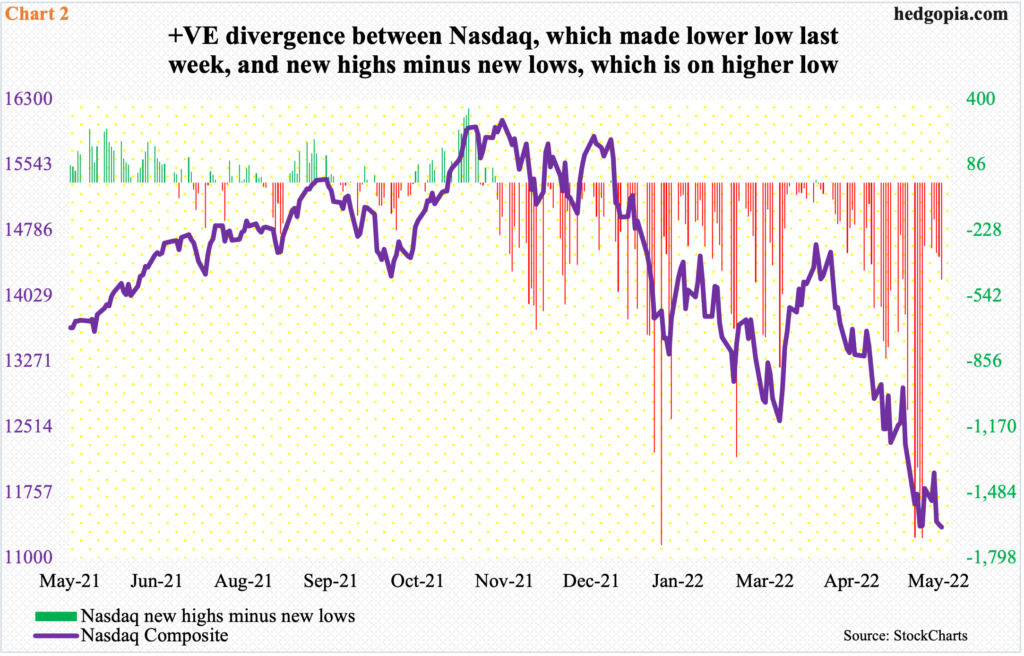
Last week, the Nasdaq intraday Friday undercut its May 12 low, but the number of new 52-week lows peaked on the 9th at 1724. Last Friday, there were 479 lows and 16 highs. The resulting spread of minus 463 is a lot better than the minus 1,701 on the 9th (Chart 2). In other words, this metric is not going along with the composite.
There is a similar positive divergence elsewhere.
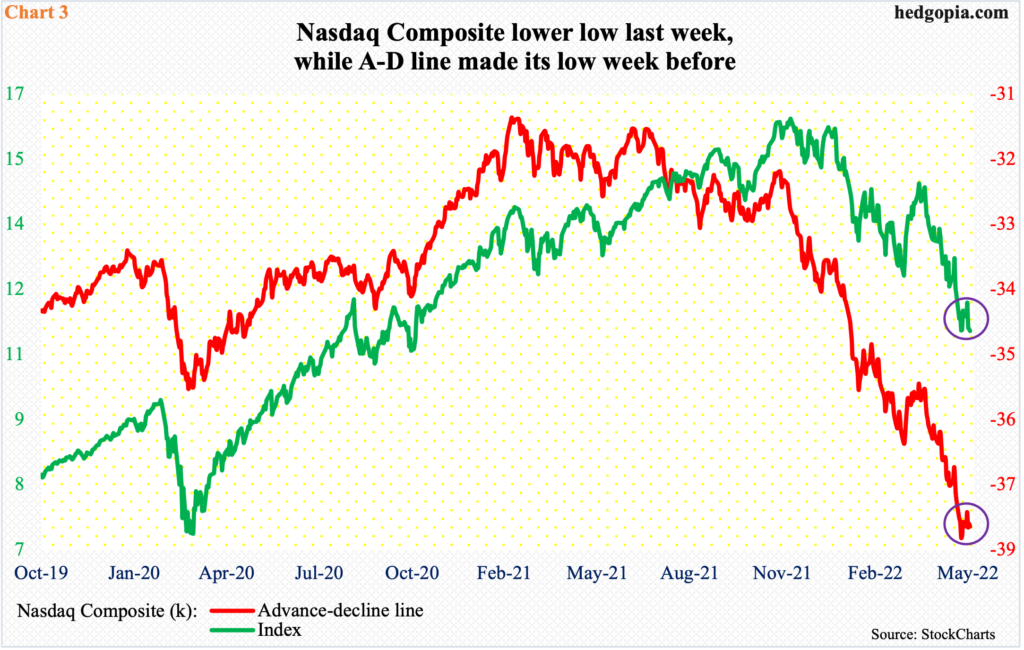
Chart 3 pits the composite with its advance-decline line. The green line uses the close, so does not capture the intraday tumble last Friday. Even using the closing price, Friday’s was the lowest print since November 2020. Not so with the advance-decline line, which made a new low on the 11th and is trying to rally off of that.
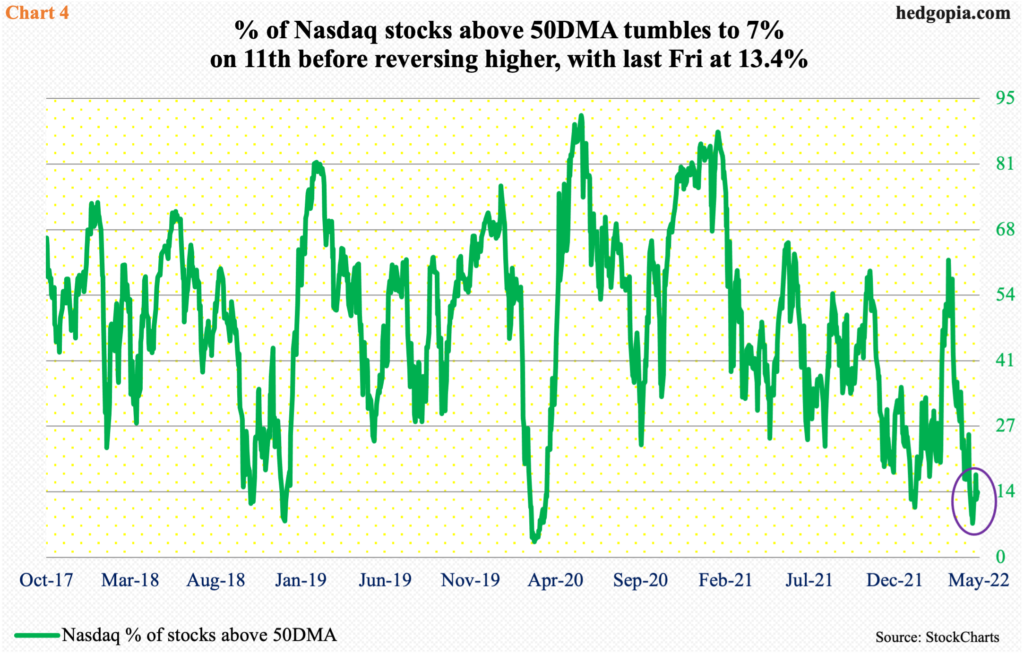
Along the same lines, merely seven percent of Nasdaq stocks were above the 50-day on the 11th. This was the lowest since March 27, 2020; to be fair, back then, this metric dropped all the way to the three handle before bottoming. Regardless, single-digit readings are rare and very oversold.
After hitting seven eight sessions ago, the green line in Chart 4 has nudged higher, with Friday ending at 13.4 percent. This is obviously diverging with how the composite is behaving and could prove to be a tell. Time will tell.
These equity indices have taken a shellacking. A breather is due – in fact, overdue. For a reflex rally to occur, the prevailing downward momentum needs to end. The charts above point to a possibility of that in the sessions/weeks ahead.
Thanks for reading!


