Option Bears Finally Show Up To The Russell 2000 Party
If you haven’t been paying attention, you may have missed the incredible run in the Russell 2000 (RUT) in 2021, which can be represented by the iShares Russell 2000 ETF (NYSEARCA: IWM). It’s not uncommon to see the RUT take a leadership role in January. In fact, there’s a whole indicator called the January Effect that has a long history. What’s unusual is the extent that the price is trading above the 200-day moving average. In fact, it’s historically high and options traders on IWM may finally taking notice.
Russell 2000 History and Composition
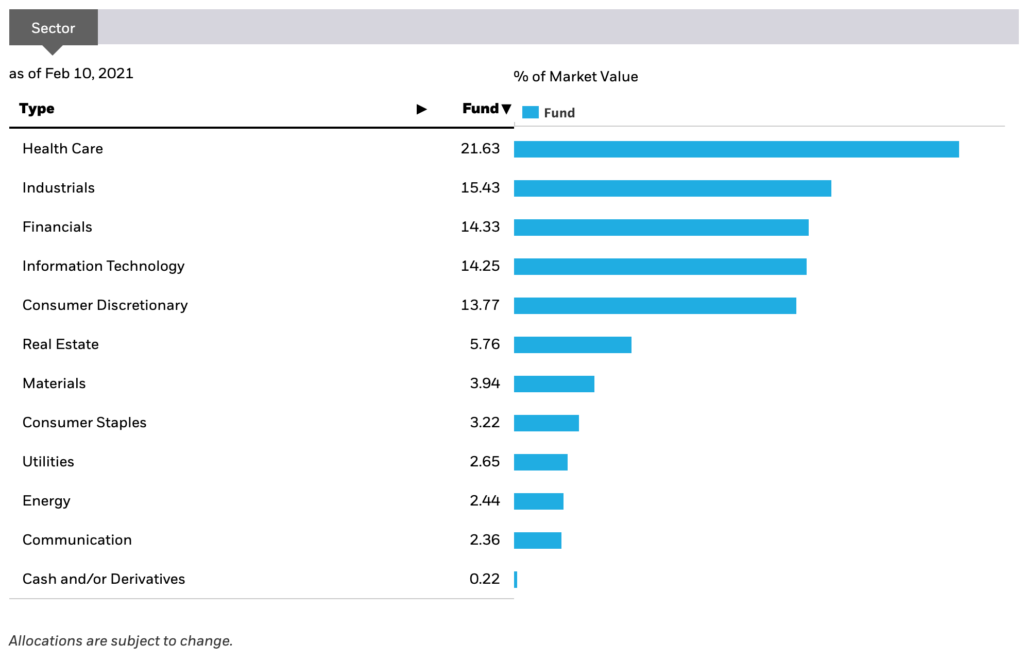
Russell Investments introduced the Russell 200 Index as the first small-cap index in 1984. Looking at the fund details for IWM, you can see the allocation by sector in the RUT. The most-represented sector is Healthcare followed by Industrials, Financials, Information Technology, and Consumer Discretionary.
If you were to break down the healthcare sector, you’ll find that about 40% to 45% of the companies are in the pharmaceutical or biotech industries. Looking at the performance of biotech since early November will partly explain the tremendous performance of the RUT.
Russell 2000 Technicals
In order to gain a little perspective on how overbought the Russell 2000 is, you can look at the percentage difference between the current price of RUT to it’s 40-week moving average. The 40-week moving average is an approximation of the 200-day moving average. The concept of the price deviating significantly from its averages is called detrending.
In the chart above, you’ll see the historical price of the RUT going back to 1999 and the 40-week simple moving average. The indicator at the bottom is the percentage that the current price is above or below the moving average. The RUT is currently over 36% higher than its 40-week moving average. This is the highest value over the period being examined and nearly 8 points higher than the 2000 peak!
To say that the Russell is at an extreme is an understatement.
Russell 2000 Option Activity
At least some market participants may be taking notice of the extraordinary position that the RUT finds itself in. On Thursday, there was a significant bearish trade that was made on IWM. The overall activity was well below its 5-day average for both call and put options. Here’s the details:
- 20,000 16 APR 21 $200 put BOT in one print @ $4.08
- 20,000 16 APR 21 $195 put sold in one print @ $3.35
On the surface, this trade looks like a long put vertical with the expectation that the price of IWM will be below $195 by expiration. However, the open interest at the $200 strike was higher than the volume and so the trade could be an opening or a closing order, and therefore rolling down a short put. Either way, the indication is the same and that is some expectation of a pull-back.
The irony here is that the $195 strike doesn’t even carry the price back to the 40-week moving average. In fact, it barely carries the price back to the 50-day moving average.
Conclusion
The options activity in IWM is moderately significant but the detrended nature of the RUT is extreme. The activity is just an indication of some interest beginning to creep into the bull’s party that is roaring unlike the index has ever really seen. Sure, this time may be different, but the likely distribution of the RUT in the coming months is likely skewed to the downside. That means the potential downside likely outweighs the upside by a rather significant margin.
Disclaimer: Neither TheoTrade or any of its officers, directors, employees, other personnel, representatives, agents or independent contractors is, in such capacities, a licensed financial adviser, ...
more


