
Opposing Opinions From Market Strategists As The Ides Of March Loom
It was a tumultuous day in the market Monday, even as the framework for a U.S./China trade deal appears to be coming together. Negotiations are in the “final stages” as the two sides plan a summit for the end of March at Mar-a-Lago, President Donald Trump’s Florida resort, sources told CNBC. If a deal is reached, the U.S. could roll back tariffs on at least $200 billion in Chinese goods while China could remove or cut industry-specific levies like those on autos.
China’s National People’s Congress is also expected to pass a new foreign investment law that would change equity ownership rules, and potentially have language about state-owned enterprise subsidies and forced tech transfers.
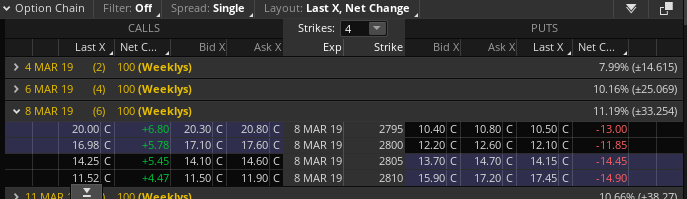
The headlines from Sunday afternoon spilled over into the markets on Monday morning but failed to maintain positive momentum for equities. All 3 major averages ran higher out of the gate on Monday but gave up all their gains before noon and the selling pressure reached its peak around 1:00 p.m. EST and before buyers stepped in. At its lows of the day, the Dow was down greater than 400 points. The S&P 500 was down some 36 points at its lows of the day and completed the weekly expected move in the 1st trading day of the week. The weekly expected move is $33/points as depicted in the screenshot below:
By the end of the day, the major averages cut their losses substantially, but still finished in the red. So what happened? Was it construction data spending that rose just 4.1% in 2018, the U.S. Census said Monday? Unfortunately, the annual bump in construction spending wasn’t enough to shield investors from the sharp decline of 0.6% in December 2018. Having said that, it’s doubtful that construction spending was what ailed the markets on Monday. After all, the Homebuilders ETF (XHB) was higher on the day. So what was it that proved to drag on markets Monday?
Two weeks ago, Finom Group (for whom I am employed) wrote the following to subscribers and it identified one of the main cogs in the 10-week market rally, Boeing (BA ).

As we discussed with members, Boeing is a price-weighted instrument within the price-weighted Dow Jones Industrial Average and the most heavily weighted at that. Big institutions have used the instrument to arbitrage the market by targeting it and triggering other algorithmic programs. Since this reporting, CNBC and other networks have picked up on this game of institutional arbitrage. (Photograph from MarketWatch)

It’s one thing to suggest the media is coming around to the aforementioned understanding of 2019’s market driver being Boeing, but here is an article from Bespoke Investment Group that suggest very much what we’ve offered in the past.
“With a gain of over 50% from its late 2018 low and a YTD gain of over 36% through last Friday’s close, it has been one of the strongest starts to a year (through 3/1) for a current DJIA component in decades.

Making its move even more noteworthy is that with a share price of more than $400 and the fact that the Dow is a price-weighted index where each component’s weighting in the index is based on its share price, BA’s rally has had a ‘jumbo’ impact on the overall index.BA’s weight in the DJIA currently stands at 11.5%, while its weighting in the S&P 500, which is a market cap weighted index, is less than 1%. As a result, through Friday’s close, the DJIA had gained 2,807 points so far in 2019 and BA accounted for 812 of them. That works out to 29% of the DJIA’s entire gain this year! Without BA’s rally, the DJIA would only be up about 8% this year versus its 11.5% gain through Friday. Behind BA, the next closest stock in terms of its impact on the DJIA this year has been Goldman Sachs (GS), which has accounted for 216 points of the DJIA’s YTD gain (7.7%).”
CNBC jumped on the Boeing story last week, recognizing its YTD rally and tying it to the possibility of a U.S./China trade resolution but also due to the company’s strong cash flow and fundamentals.
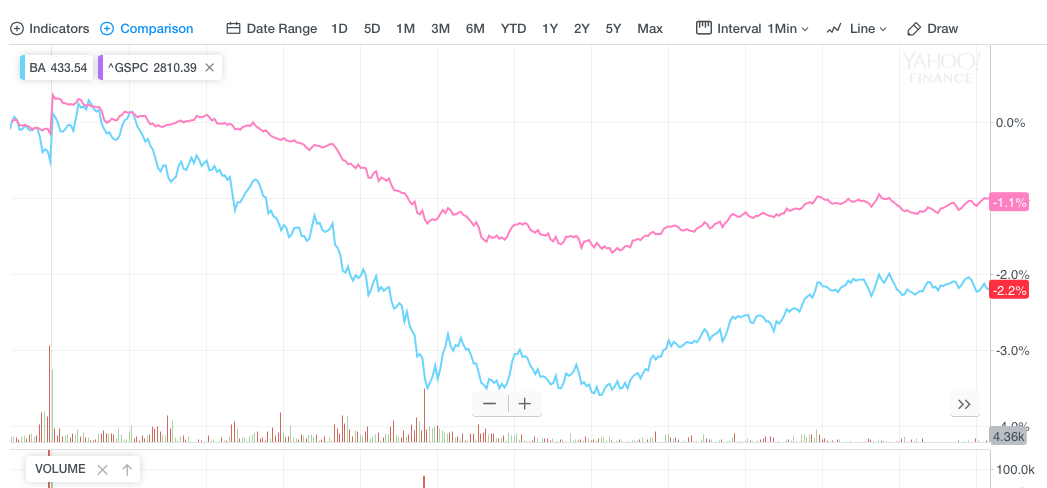
With all that being said, however, and after an upgrade last Friday, BA shares didn’t follow the broader market out of the gate on Monday. They were fractionally positive when the market opened for trading and quickly fell into negative territory. It didn’t take too much time before the rest of the market rolled over, pulled down by BA shares.
With markets proving to express overbought and exhaustive conditions, BA shares proved the impetus for the market sell-off on Monday. This was something Finom Group also alerted its subscribers to in its weekly research report by suggesting the following:
“With regards to Boeing, we encourage investors to understand that this stock is another cornerstone to the market presently and one that hopefully does not give way. Should that happen, it would likely create a vacuum effect in the market whereby investors more predominantly focus on the price of crude oil, the strength of the U.S. Dollar and of course fund flows.”
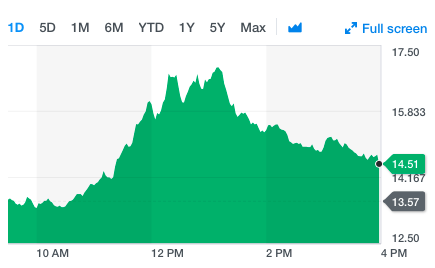
Monday’s market swings brought with it opportunities, given the volatile price swings. The VIX itself soared more than 20% on Monday, from roughly 13.5 to just under 17 at one point.
And the Volatility of Volatility Index (VVIX) rose above 90 intraday on Monday. In fact, since 2007 Monday was the first day in that entire time frame where the index was in the 70s, 80s, and 90s in the same day. The last time it saw 3 different 10-level zone achievements in one day, the S&P 500 dropped -3.1% the next day. Nobody wants to hear that or experience that!
Another measure of just how volatile markets were on Monday was felt within the VIX Futures. With the VIX falling some 75% in 2019, VIX futures have also decayed greatly and been found with greater contango. On Monday, every bit of contango was erased, at least temporarily.
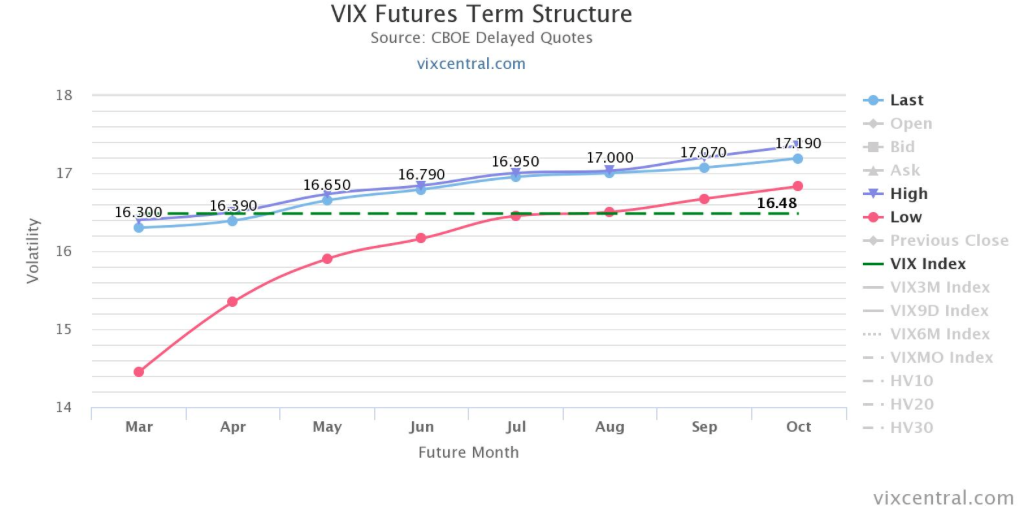
The front-month VIX Futures contract (m1) fell further and from its back month contract (m2), producing 6% contango in the early morning trade, but went from 6% contango to 0% contango in one day. Pretty strong reaction for VIX Futures term structure. By the end of the day, there was 3.93% contango on the front month VIX Futures. Again, Monday was quite a volatile day!
Many media pundits and analysts suggested the Monday sell-off was a perfect representation of “trade deal fatigue”, suggesting the markets reaction to the latest trade deal headline was validated the thesis. In our view, this remains speculation and especially given Boeing’s leadership on Monday and year-to-date.
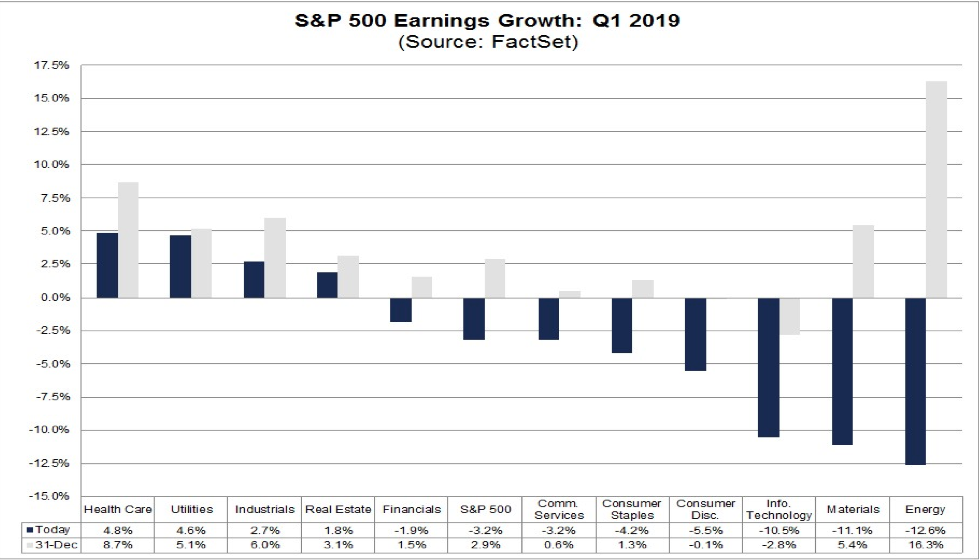
March is upon investors and the earnings season is coming to an end. Retailers are set to close out earnings season, by and large, this week. The impetus for the market rally to persist through March seems lacking, especially as Q1 2019 EPS is expected to decline by 3.2% according to FactSet data.
Nomura’s Charlie McElligott, suggests the Ides of March will bring with it a reversal in equities. Here are McElligott’s main points that he believes will herald a reversal in U.S. equities near-term.
- Seasonality of the March Quarterly Options “Quad Witch” Expiry (which historically sees Equities “trade up” into then sell-off thereafter), which is ESPECIALLY notable in light of...
- Current “extremes” in $Delta (SPX / SPY / QQQ) and $Gamma (QQQ) which could also align with...
- The commencement of the next Corporate Buyback “blackout” into earnings season, together with
- Another “mechanical” function of Systematic Trend / CTA’s over-weighted allocation to the 1Y period model and the “pull higher” of SELL trigger levels—all of which could conspire to create a “gap lower” risk for markets on a “pure” tactical reversal in short-term “supply/demand” dynamics.
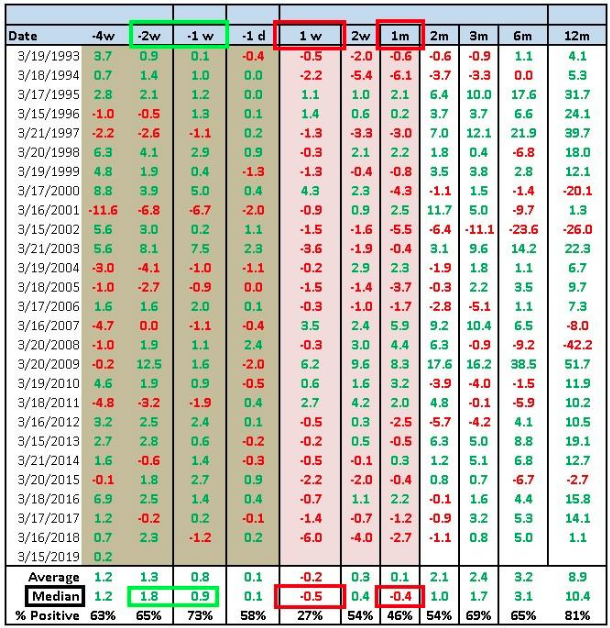
Breaking down these points further, the Nomura strategist notes that the first potential catalyst would be the SPX seasonality around March quarterly Op-Ex—where we typically see stocks “trade up” into, then “trade down” out of massive quad-witch “serial expiry” (this year on March 15th).
- In particular, last year’s Op-Ex marked the “next wave” of the fund “gross-down” following the initial “Vol Event” in the leveraged VIX ETN space and overall “negative convexity” strategy universe following January’s “inflation impulse”—with SPX -6.0% the week following Op-Ex / -4.0% out 2w / -2.7% out 1m.
This is particularly important in light of the currently very high percentiles in SPX/SPY/QQQ consolidated $Delta/and QQQ $Gamma
- Consolidated SPX/SPY $Delta is currently 96th %ile (6Y look back), while $Gamma is 68th %ile and growing.
- Still, very crowded “Growth” proxy QQQ $Delta is currently 97th %ile, while $Gamma is 89th %Ile.
The punch line for a potential "Ides of March" moment is this: if we see the seasonal post-serial options expiration / quad-witch rally-then-pullback phenomenon occur (as has been the median outcome over the past 25 years), which this year could look even more exaggerated on account of the extreme $Delta / $Gamma currently seen in SPX/SPY/QQQ (Consolidated SPX / SPY $Delta is currently 96th %ile and crowded “Growth” proxy QQQ $Delta is currently 97th %ile while $Gamma is 89th %ile), it would then converge with the “demand vacuum” of the onset of the “corporate blackout” window (75% into blackout by 3/19/19) at the same time alongside a mechanically-driver “higher sell pivot” levels in the 1Y CTA model for both SPX and NDX which could potentially dictate outright SELL flows—thus, we could have the makings of a "March Surprise."
The specific SPX seasonal pattern over the past 25 years surrounding the March serial options expiration, or the "trade up" into, "trade down" out of pattern, is shown below:
One of the more significant factors surrounding McElligott’s “vacuum” effect thesis is the lack of volume and CTA/hedge fund positioning through the 2019 rally. Long-short hedge funds on Credit Suisse Group AG’s prime brokerage platform have reduced their net exposure to equities in the last two weeks as they ramp up short bets.
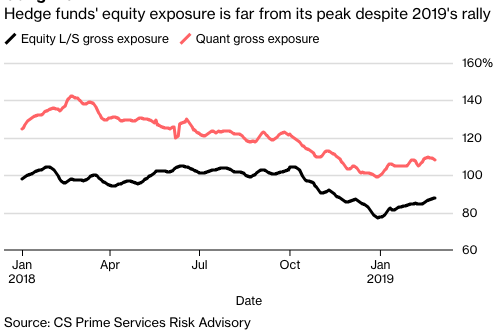
Not only are they wagering on single-stock declines, they’re skeptical about this gravity-defying market overall. After slashing positions amid last quarter’s carnage, their gross positioning remains well below last year’s peaks -- a 13% dip for long-short managers and 22% lower for quants.
Trend-following quants known as CTAs haven’t added long positions on U.S. futures of late, according to estimates of their returns’ beta to the S&P 500, or the portion attributable to the benchmark. Mark Connors, global head of risk advisory at Credit Suisse recently said that economic fundamentals seem disconnected from the uptrend, and many of their favorite plays like technology are no longer leading gains. Connors believes a pullback would lend itself to more gains in the year.

“If this market continues to run, there might be what we call a chase,” said Connors. “The ideal opportunity, which I think some people would like to see, is if we had a reversal and rotation that follows fundamentals.”
The lack of participation is also reflected in this year’s performance, with the Hedge Fund Research HFRX Equity Hedge Index up 5% while the SG CTA Index is down almost 1 percent. Meanwhile, investors cheering a dovish turn by the Federal Reserve and apparent progress in U.S.-China trade talks have sent the MSCI World gauge soaring nearly 11 percent.
Regardless of CTA trend-following strategies and current hedge fund positioning in the market, there are an equal amount of analysts and strategists whom are of the opinion the market will achieve new highs in 2019.
“Our key theme remains that the current market backdrop has similarities to ’15-’16 mid cycle correction episode, and not to the end of the cycle,” said Mislav Matejka, head of global equity strategy at JPMorgan Chase & Co., in a Monday report.”
The strategist highlighted that after a nearly 20% correction in 2015 and 2016, stocks rose 43% in the following 2 years.
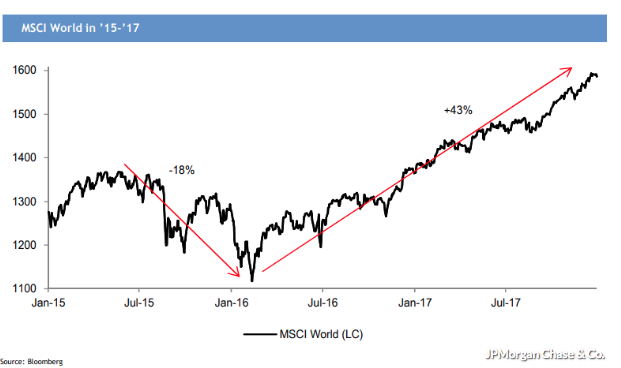
“Similarly, we believe the current bounce is far from done and we believe equities could potentially make new highs for the cycle before the next recession starts.”
Akin to the positive sentiment offered by Matejka, Savita Subramanian, an equity and quant strategist at Bank of America Merrill Lynch believes the January and February market performance point to future gains.
“A positive January-February has historically led to a positive year 87% of the time since 1928 and an average +16.8% total return, compared to a 54% hit rate and 3.7% average return when returns were negative in January-February,” she wrote in a note to clients.
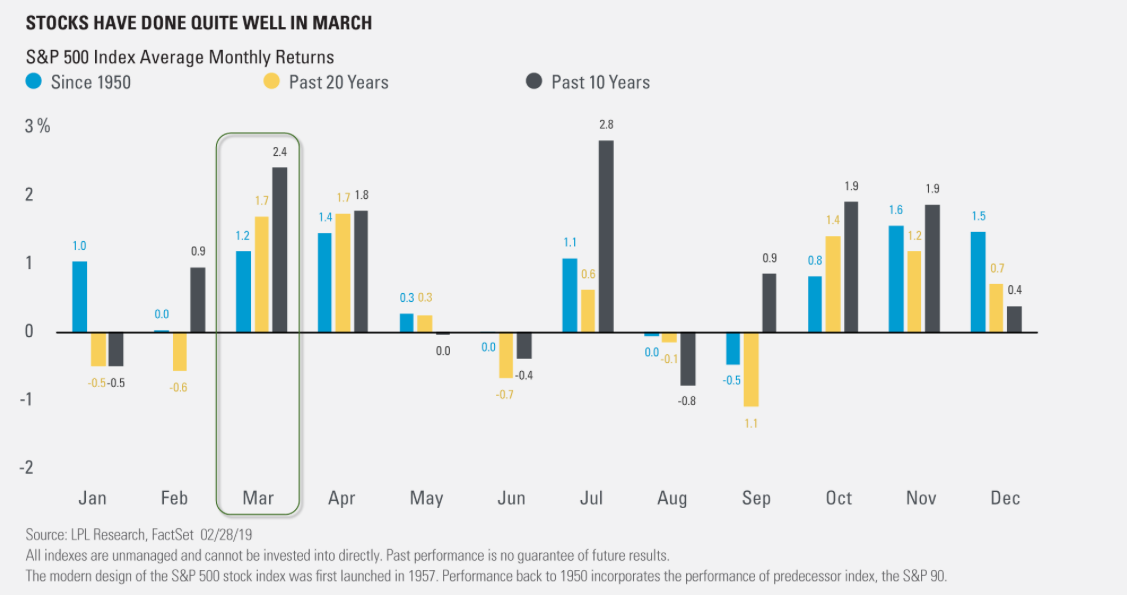
Even if we blindfold ourselves from the first 2 months performance in 2019, we come to understand that over the past 10 and 20 years, March has been the second strongest month of the year on average, and April has been pretty good as well. Check out the LPL Financial chart below:
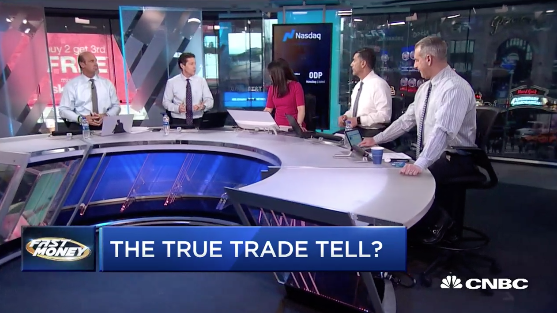
So while some analysts and strategists are warning investors about the Ides of March, others are using history as a guide and thesis for a positive outcome in March and for the fiscal year. As he has widely been recognized as an eternal bull on Wall Street, Tony Dwyer aired his latest sentiment and forecast for the markets in 2019 and in a recent appearance on CNBC’s Fast Money.
Dwyer notes that the recent Breadth Thrust, 92% of stocks in the S&P 500 above their 50-DMA, historically heralds a 9% gain over the next 6-12 months. Nonetheless, he also believes a pullback in the markets will be found, but the Breadth Thrust suggests investors should “buy that dip”.
Additionally, Dwyer tackles the fear surrounding earnings estimates that have come way down for Q1 2019. He likens the earnings revisions to that which were found in 2016 to be negative by yearend, but the market went up some 20% thereafter.
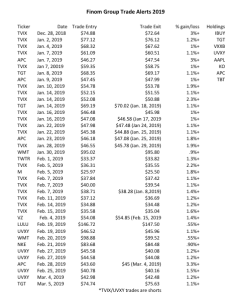
As I conclude this morning’s Daily Market Dispatch, please review Finom Group's daily trading activity, year-to-date that includes Tuesday's trade on shares of Target Corporation (TGT ).
It remains to be seen whether or not Monday’s selling pressure will develop further or find some relief. Earnings this morning out of Target came in better than expected and with even more favorable guidance. Shares of TGT are bid up sharply today, but we would be remised if we didn’t recall that Wal-Mart (WMT ) offered a similar post-earnings reaction before giving up all of its gains within 2 trading sessions. We’ll see what Tuesday has in store and invite traders to be mindful of allocations near-term and have a shopping list of equities/ETFs prepared should a market pullback of significance present itself.


