
Only Two S&P 500 Sectors Have A Rising ROIC Through 3Q20

This report analyzes the drivers[1] of economic earnings [return on invested capital (ROIC), NOPAT margin, invested capital turns, and weighted average cost of capital (WACC)] for the S&P 500 and each of its sectors.
For reference, we analyze the Core Earnings for the entire S&P 500 in “S&P 500 Valuation Remains Over Its Skis” and for each S&P 500 sector in “Only Three S&P 500 Sector’s Core Earnings Improved in 2020.”
These reports leverage cutting-edge technology to provide clients with a cleaner and more comprehensive view of corporate performance[2]. Investors armed with our measures of profitability enjoy a differentiated and more informed view of the fundamentals of companies and sectors.
Only the Consumer Non-cyclicals sector and the Technology sector have seen an improvement in return on invested capital (ROIC) since the end of 2019.
S&P 500 ROIC Falls Significantly Thus Far in 2020
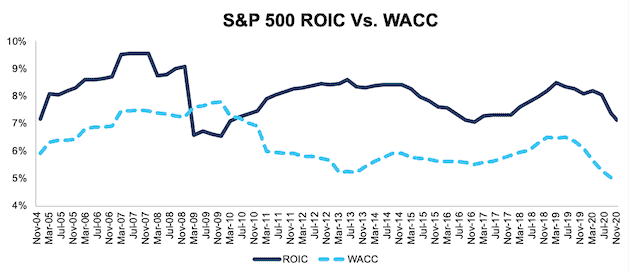
ROIC for the S&P 500 began to decline in 2019 before falling significantly this year. The S&P 500’s ROIC fell from 8.2% at the end of 2019 to 7.1% through 11/17/20 (the earliest date updated 10-Qs for the S&P 500 constituents were available), per Figure 1. All S&P 500 sectors except for two saw a drop in ROIC, though some more than others, as we’ll show below. We expect these trends to continue at the overall market and sector levels. Nevertheless, at the individual stock level, we see excellent long and short opportunities in the companies whose performances diverge materially from their sector and the overall market. For details, see our reports: “See Through the Dip Stocks Remain Attractive Part 2” and “ The Most Dangerous Stocks for Fiduciaries.”
Figure 1: TTM ROIC and WACC for the S&P 500 From December 2004 – 11/17/20
Sources: New Constructs, LLC and company filings.
Ranking the S&P 500 Sectors by Change in ROIC
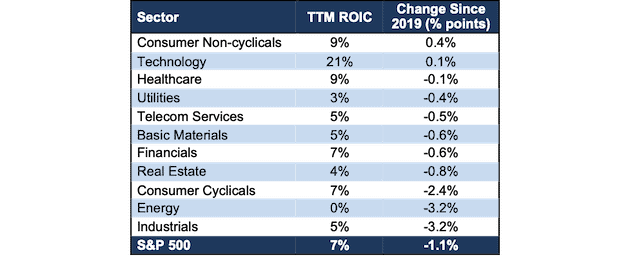
Figure 2 ranks all 11 S&P 500 sectors by the change in ROIC from the end of 2019 through 11/17/20.
Figure 2: TTM ROIC as of 11/17/20 vs. 2019 by Sector
Sources: New Constructs, LLC and company filings.
The Consumer Non-cyclicals sector has performed best through the COVID-19 pandemic, as measured by change in ROIC, since the end of 2019. This trend is not surprising, given that the global shutdowns impacted travel, infrastructure, leisure, and other discretionary spending while providing a boost to many Consumer Non-cyclicals firms.
On the flip side, the Industrials sector has the largest drop in ROIC and performed worst since the end of 2019.
Overall, the Technology sector earns the highest ROIC of all sectors, by far, and the Energy sector earns the lowest ROIC. These trends, in the Technology and Energy sector mirror the changes in Core Earnings we analyze in “Only Three S&P 500 Sector’s Core Earnings Improved in 2020.”
Details on each of the S&P 500 Sectors
Figures 3-13 compare the ROIC and WACC trends for every sector since 2004. Appendix I presents the current WACC for each sector.
Appendix II presents the drivers of ROIC – NOPAT margin and invested capital turns – for each sector.
Appendix III presents additional ROIC analysis based on different weighting methodologies to adjust for the impact of a firm’s size on the overall sector and market.
Basic Materials
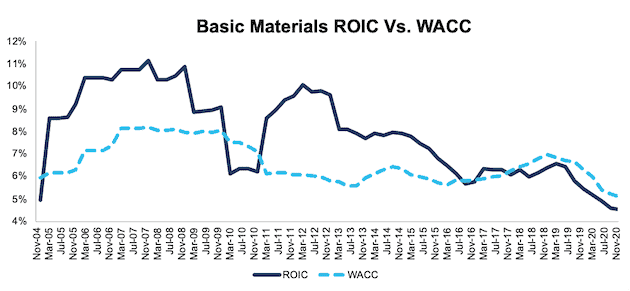
Figure 3 shows the ROIC for the Basic Materials sector has been in a long-term decline since ~2011 and fell 60 basis points since the end of 2019. The Basic Materials sector ROIC was and remains below the sector’s WACC. NOPAT margin fell from 10.2% in 2019 to 9.6% TTM, while invested capital turns fell from 0.51 to 0.47.
Figure 3: Basic Materials ROIC vs. WACC: December 2004 – 11/17/20
Sources: New Constructs, LLC and company filings.
Consumer Cyclicals
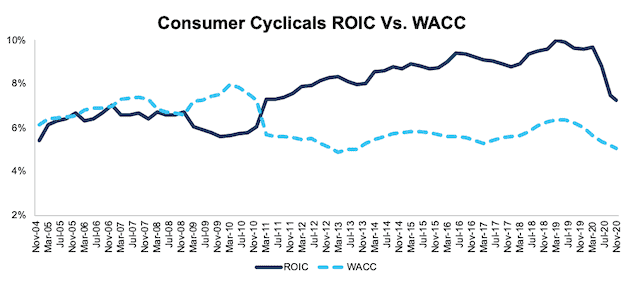
Figure 4 shows the ROIC for the Consumer Cyclicals sector was hit hard by the COVID-19 pandemic and has fallen to its lowest level since 2010. The significant decline in 2020 follows the large drop in Core Earnings highlighted in “Only Three S&P 500 Sector’s Core Earnings Improved in 2020.” This decline is the result of deteriorating operational and capital efficiency. NOPAT margin fell from 8.0% to 6.4% since the end of 2019 and invested capital turns declined from 1.21 to 1.12 over the same time.
Figure 4: Consumer Cyclicals ROIC vs. WACC: December 2004 – 11/17/20
Sources: New Constructs, LLC and company filings.
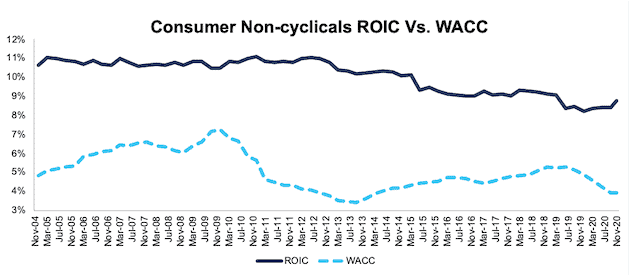
Consumer Non-cyclicals
Figure 5 shows ROIC for the Consumer Non-Cyclicals sector rose over the past four quarters and, at 8.8%, is at its highest level since 2018. While the TTM NOPAT margin of 6.3% is equal to its 2019 level, invested capital turns rose from 1.33 in 2019 to 1.39 TTM and drove ROIC higher. Investors only analyzing margins will miss the fact that improved balance sheet efficiency drives ROIC higher for many companies in this sector.
Figure 5: Consumer Non-cyclicals ROIC vs. WACC: December 2004 – 11/17/20
Sources: New Constructs, LLC and company filings.
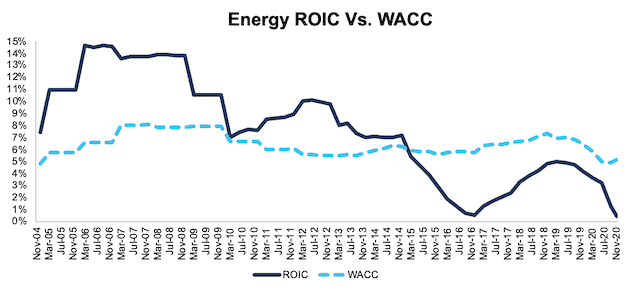
Energy
Figure 6 shows the ROIC for the Energy sector is hit hardest of all sectors as the COVID-19 pandemic combined with increased production from Saudi Arabia and Russia drove oil prices down. The deteriorating ROIC wiped out all the improvement achieved from 2016 to mid-2019. The decline in ROIC is largely driven by NOPAT margin falling from 8.2% at the end of 2018 to 1% TTM. Invested capital turns also fell from 0.61 to 0.43 over the same time.
Figure 6: Energy ROIC vs. WACC: December 2004 – 11/17/20
Sources: New Constructs, LLC and company filings.
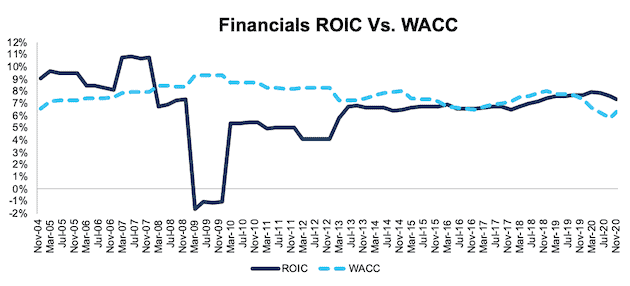
Financials
Figure 7 shows ROIC for the Financials sector declined 63 basis points since the end of 2019 but remains well above the lows of the Financial Crisis. Given the stability in ROIC since 2013, one could argue regulators were successful in turning large Financial firms into “boring”, more stable businesses. NOPAT margin fell slightly, from 15.0% at the end of 2019 to 14.9% TTM, and invested capital turns fell from 0.53 to 0.49 over the same time.
Figure 7: Financials ROIC vs. WACC: December 2004 – 11/17/20
Sources: New Constructs, LLC and company filings.
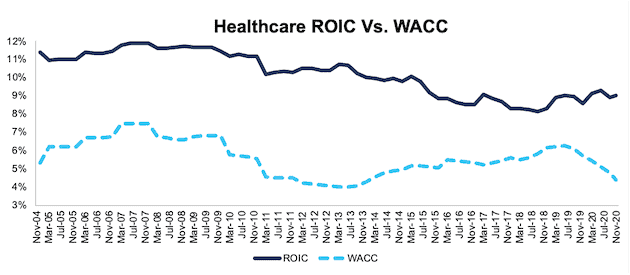
Healthcare
Figure 8 shows ROIC for the Healthcare sector declined just 13 basis points since the end of 2019 and has remained relatively stable since the end of 2016. The decline in ROIC is driven by NOPAT margin falling from 10.5% to 10.2% since the end of 2019. Meanwhile, invested capital turns have improved from 0.87 to 0.88 over the same time.
Figure 8: Healthcare ROIC vs. WACC: December 2004 – 11/17/20
Sources: New Constructs, LLC and company filings.
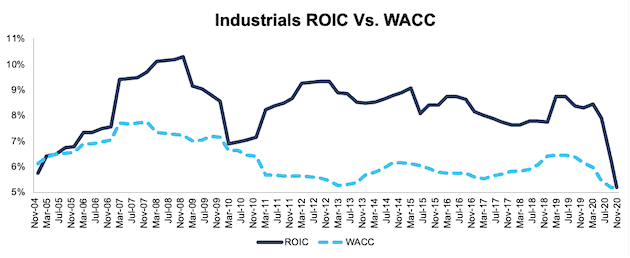
Industrials
Figure 9 shows ROIC for the Industrials sector was the second hardest hit this year and fell 322 basis points since the end of 2019 as the sector bore much of the brunt of the global shutdowns. NOPAT margin fell from 10.7% at the end of 2019 to 7.6% TTM, and invested capital turns fell from 0.79 to 0.69 over the same time.
Figure 9: Industrials ROIC vs. WACC: December 2004 – 11/17/20
Sources: New Constructs, LLC and company filings.
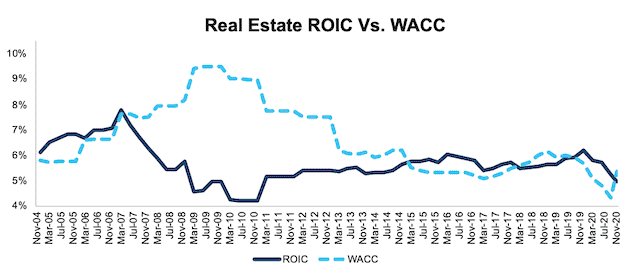
Real Estate
Figure 10 shows ROIC for the Real Estate sector has fallen significantly since the end of 2019. Longer term, the ROIC for the Real Estate sector has yet to reach the highs achieved prior to the Financial Crisis. NOPAT margin, which fell from 24.5% at the end of 2019 to 22% TTM, and invested capital turns, which fell from 0.22 to 0.20 over the same time, have driven the sector’s ROIC lower.
Figure 10: Real Estate ROIC vs. WACC: December 2004 – 11/17/20
Sources: New Constructs, LLC and company filings.
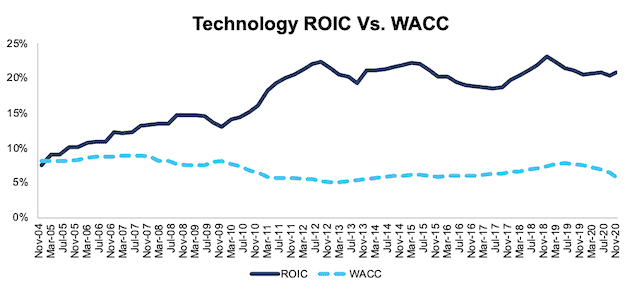
Technology
Figure 11 shows the ROIC for the Technology sector has declined since the end of 2018 but remains in a long-term uptrend. The Technology sector has the highest ROIC of any sector by a wide margin, and since 2019, is one of only two sectors to have improved its ROIC. The Technology sector’s NOPAT margin improved from 19.9% at the end of 2019 to 20.3% TTM. Invested capital turns of 1.03 over the TTM are unchanged from 2019.
Figure 11: Technology ROIC vs. WACC: December 2004 – 11/17/20
Sources: New Constructs, LLC and company filings.
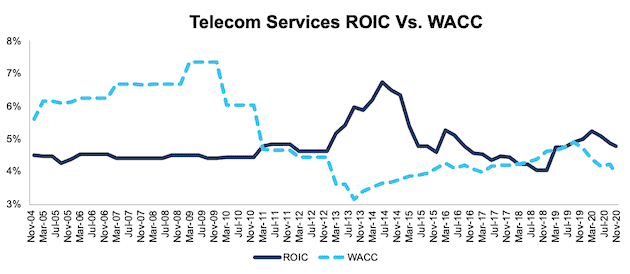
Telecom Services
Figure 12 shows the ROIC for the Telecom Services sector has fallen 46 basis points since the end of 2019 and remains well below its peak in mid-2014. The NOPAT margin for the sector fell from 14.6% at the end of 2019 to 13.8% TTM and invested capital turns fell from 0.36 to 0.34 over the same time.
Figure 12: Telecom Services ROIC vs. WACC: December 2004 – 11/17/20
Sources: New Constructs, LLC and company filings.
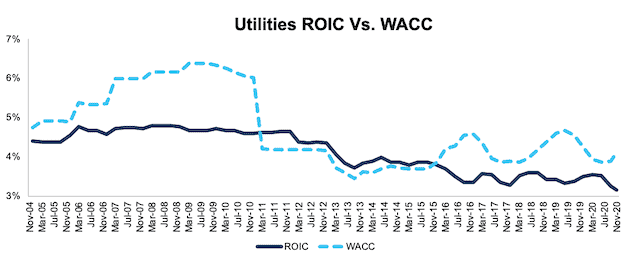
Utilities
Figure 13 shows the ROIC for the Utilities sector declined 38 basis points since the end of 2019 and remains below the sector’s WACC. The decline this year follows the long-term trend since 2004. NOPAT margin for the sector fell from 16.4% at the end of 2019 to 15.8% TTM while invested capital turns fell from 0.22 to 0.20 over the same time.
Figure 13: Utilities ROIC vs. WACC: December 2004 – 11/17/20
Sources: New Constructs, LLC and company filings.
Disclosure: David Trainer, Kyle Guske II, and Matt Shuler receive no compensation to write about any specific stock, style, or theme.


