
One Bank Asks "Was That It" For The Selloff... And Answers
One week after Deutsche Bank's fund flow strategist Parag Thatte noted that the sharp market drop to start May, the worst in 50 years, was "overdue" as (i) the rally since late December had been unusually long (91st percentile) and strong (96th percentile); (ii) equities at the recent peak had already priced in a rebound in growth; and (iii) positioning had become extended according to a number of indicators, he is back late on Friday, wondering whether "this was it" for the correction.
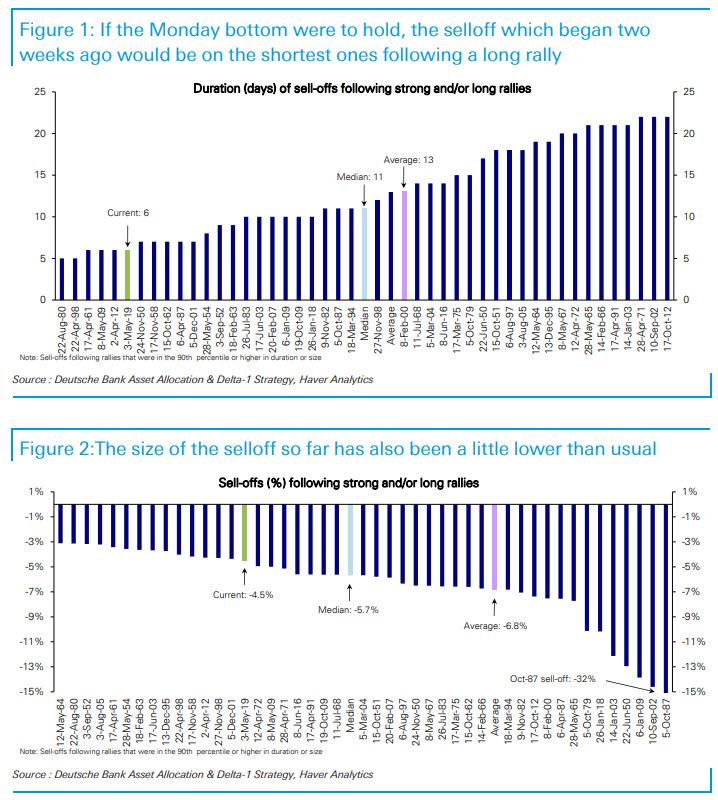
The reason: following an almost record rally to start the year, so far the selloff has been smaller and the rebound quicker than usual.
As shown in the chart below, at the recent bottom on Monday, the market was down almost 5% from the peak, in-line with normal selloffs (3-5%) which occur every 2-3 months but somewhat less than the 5-7% selloffs which typically follow long and strong rallies. If Monday indeed marked the bottom, Thatte notes that "the selloff would also be much shorter than the usual 2-3 weeks the market takes to find a bottom" although considering the escalating trade war with China, which now appears set to last for months, the probability of another sharp move lower is increasing by the day.
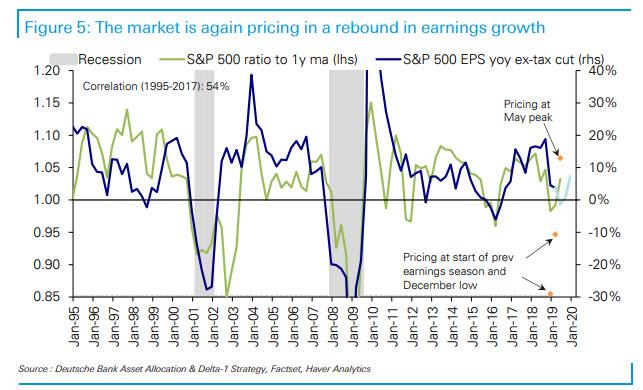
Meanwhile, at the recent peak the market had run ahead and was already pricing in a strong rebound in macro as well as earnings growth, according to DB estimates. Alternatively, at the Monday bottom, the market was back in line with current growth but with the latest modest rebound, it is again slightly ahead, leaving it vulnerable in the near term.
Last week's muted drop in the S&P 500 stood out starkly against the backdrop of yet another massive equity fund outflow (which hasn't stopped since the start of the year) at -$19.5 billion was the largest since December, taking the total in the last two weeks to -$40 billion, the largest since December.
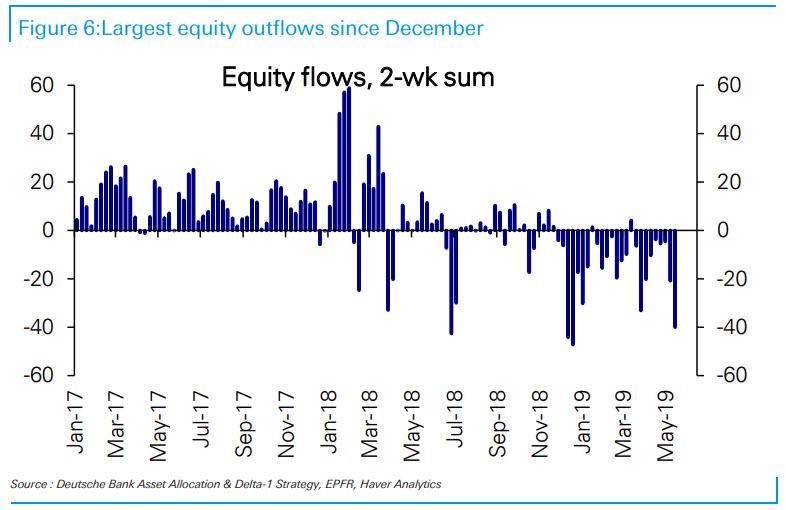
As the Deutsche Bank strategist notes, outflows were very broad based across regions and countries this week except for one notable outlier: China equity funds saw a large $2.6 billion inflow, similar to those seen during market selloffs in October and December last year. Excluding China, the rest of EM saw large outflows (-$4.3 billion) as did the US (-$8.1 billion), Europe (-$4.5 billion) and Japan (- $1.8 billion). As the market turned around on Tuesday, equity ETFs saw inflows return on Wednesday and Thursday.
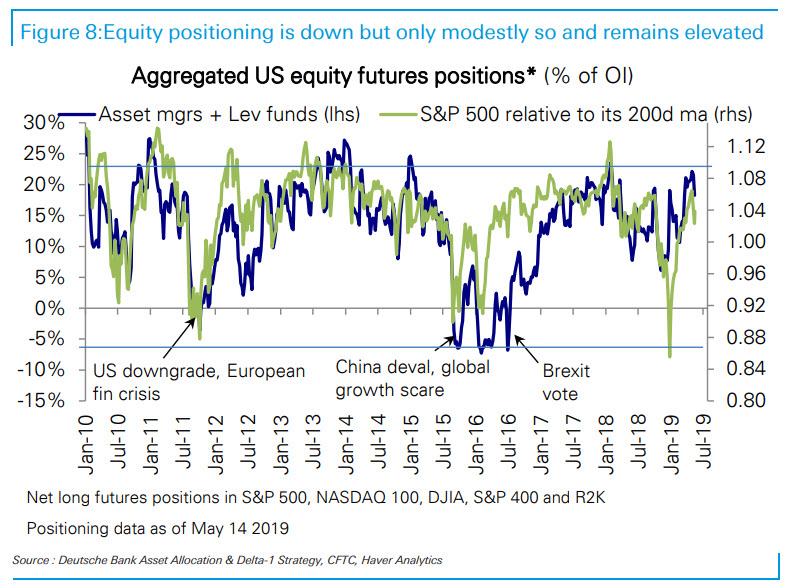
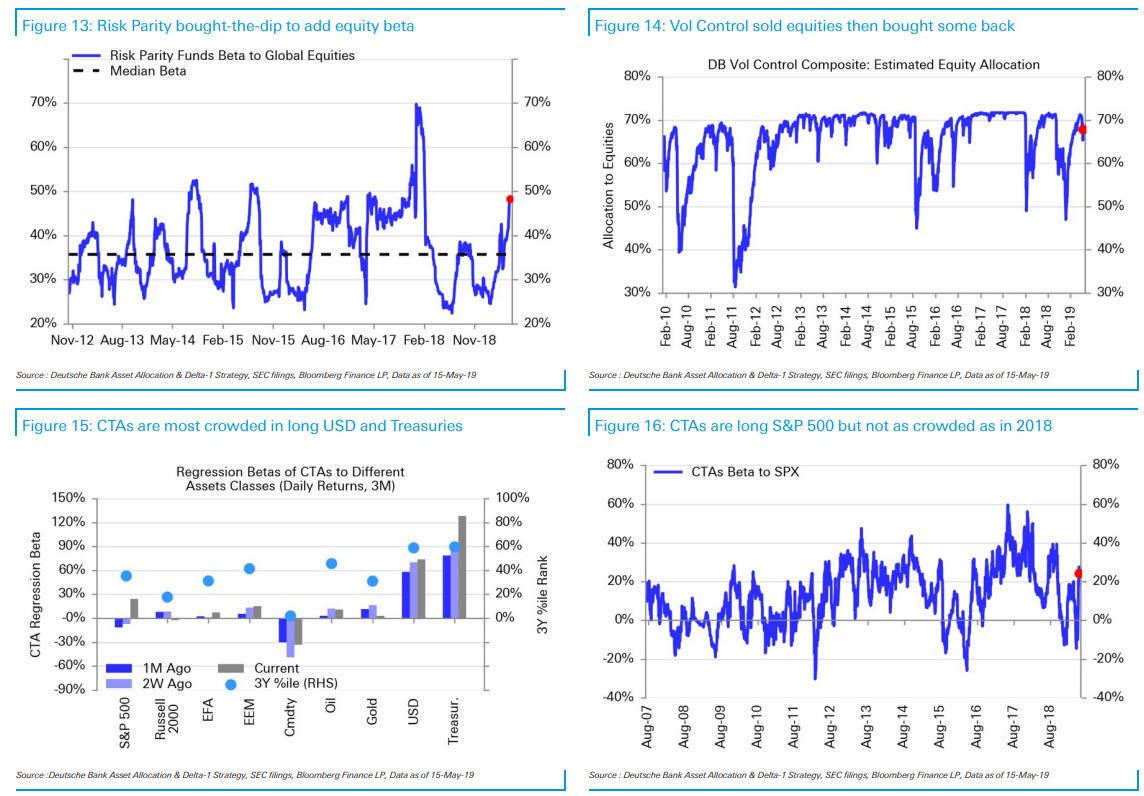
Perhaps in delayed response to the sharp escalation in trade war, last week saw modest cuts in equity positioning, with equity futures net long positions which were at the top of their historical range going into the selloff, now reduced but only modestly so and remain elevated. Following the recent spike in VIX, vol control funds sold $13-$15 billion in equities on the sell-off but then partially reversed that buying$5-7 billion back this week as VIX moderated.
As discussed last week, trend-following CTAs trimmed S&P 500 exposure but are still long.In aggregate, the complex remains net long S&P 500 but with lighter positioning relative to 2018. CTA positioning is most crowded in long USD and long Treasuries. Risk Parity bought-the-dip to add equity beta.Equity L/S trimmed gross leverage despite low net beta.
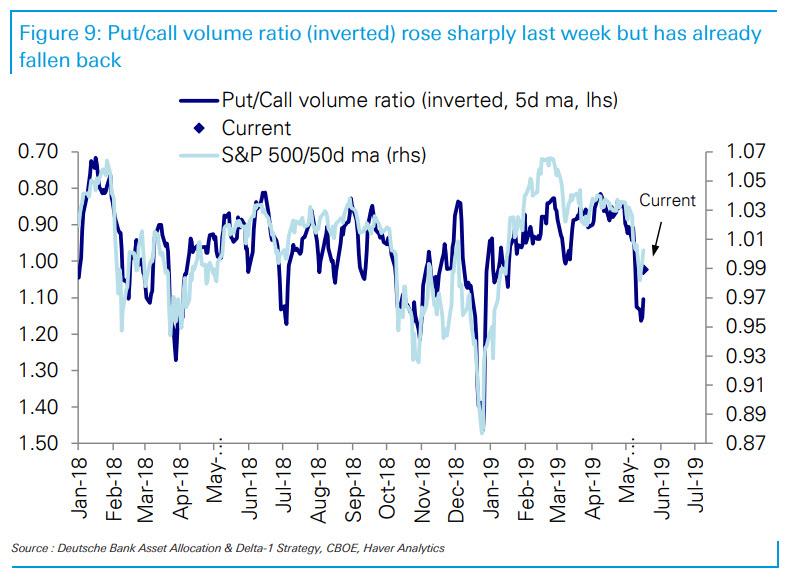
Derivatives metrics like put/call ratios, S&P 500 option skew, and VIX jumped very quickly from indicating bullish equities positioning to more bearish but have now moderated. Investor sentiment surveys also swung sharply from bullish to bearish in the space of a week and it would be interesting to see if the subsequent market rebound leads to optimism again.
Looking at the latest CFTC data, the record short in VIX futures at the end of April reverted in May as volatility increased and long VIX ETPs saw corresponding outflows. VIX futures positioning is now in-line with historical averages.
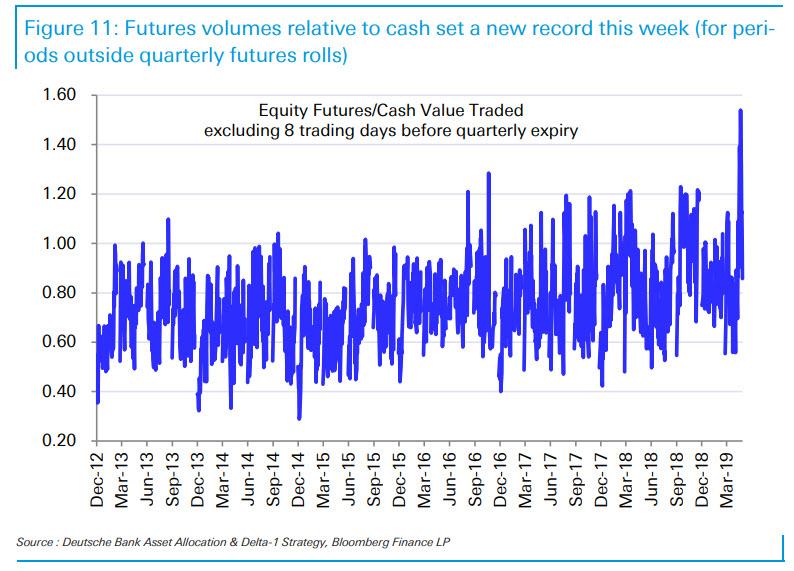
Positioning and flows aside, the bigger risk is that liquidity remains very low which means outsize reactions to small changes in positioning and flows. Despite high futures volumes relative to cash this week, on-screen liquidity in S&P 500 futures is still very low relative to history.
Bid-ask quotes within 1 index point of spot have been less than 50% of their previous 5Y average since February 2018.
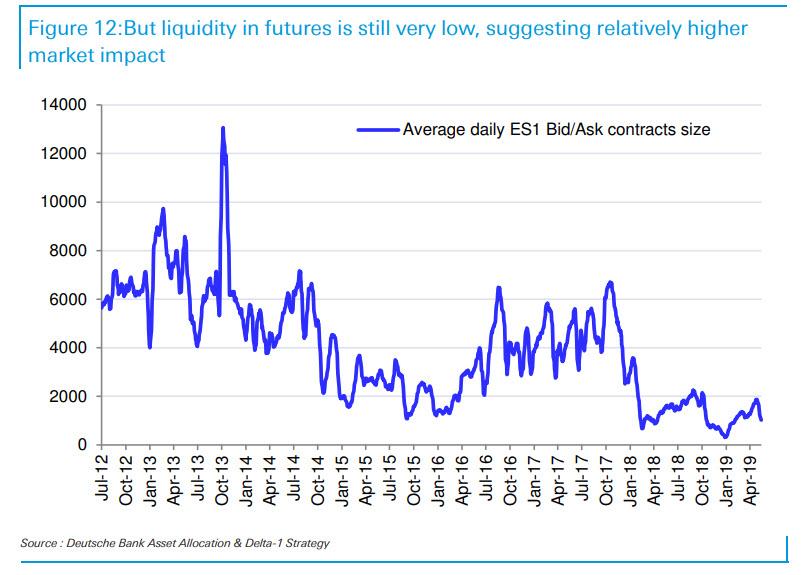
According to Deutsche, this low liquidity means small changes in positioning can have outsized market impact, similar to the dynamics in late December 2018 when low liquidity exacerbated the volatility spike and sell-off.
Which means that with both volume, volatility and liquidity sliding, all that would take for another major selloff a la December 2018, is another surprise tweet, similar to Trump's May 5 shocker, for the simple reason that, as Deutsche Bank concludes, the "rebound has been quicker than typical, with market pricing again ahead of current growth and much of the cut in positioning has already reversed... leaving the market vulnerable to negative catalysts."
Disclosure: Copyright ©2009-2018 ZeroHedge.com/ABC Media, LTD; All Rights Reserved. Zero Hedge is intended for Mature Audiences. Familiarize yourself with our legal and use policies every ...
more

