
Oil Up 20% In 8 Days. What’s Next?
The price of brent crude oil has shot up by nearly 20% in just over a week, following our 2018 prediction that the oil market would be the comeback king for this year.
So why has oil jumped, what's next and how can you take advantage? Keep reading to find out!
The facts behind the oil price surge
On the 7 December 2018, OPEC, Russia and other oil-rich nations made an agreement to cut 1.2 million barrels of oil from the market every single day for the first six months of 2019, creating an imbalance between the supply of and demand for oil. Simply, removing so much of the oil supply while demand remains the same can result in big price swings as the market rebalances itself.

However, according to the Wall Street Journal, Saudi Arabia is planning deeper production cuts than agreed upon at last year's OPEC+ meeting. In fact, they plan to lower oil exports to 7.1 million barrels per day by the end of January, in an effort to push brent crude oil prices back up to $80 per barrel, which is their break even point.
But limited supply isn't the only culprit - another reason oil surged higher in the first two weeks of January is due to the market's position at the start of the year. In 2018, the price of brent crude oil crashed 42% it's annual high, leading many short traders to bail out of their positions at the hint of any good news.
This is known as a short squeeze, where a heavily shorted market moves sharply higher as short sellers close out their positions, adding more upward pressure on the market's price.
Will oil prices continue to push higher?
Now that oil has risen by nearly 20%, many traders are wondering whether there is scope for the oil price to continue to climb.
Continuing limited supply and unwinding short positions both paint a very strong picture for further gains to be made in oil prices. And, with most investment banks and analysts suggesting higher prices, the market is heavily leaned towards further upside, with brent crude oil price forecasts ranging from $60 to $72 per barrel.
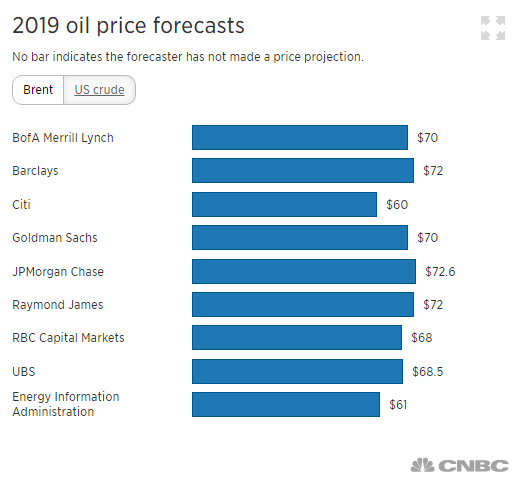
Source: CNBC
Given that the highest price level reached in the first two weeks of trading in 2019 was around $62 per barrel, oil has plenty of room for further gains.
So how can traders take advantage of this situation? Let's take a look!
How short term traders could profit from oil
(Click on image to enlarge)
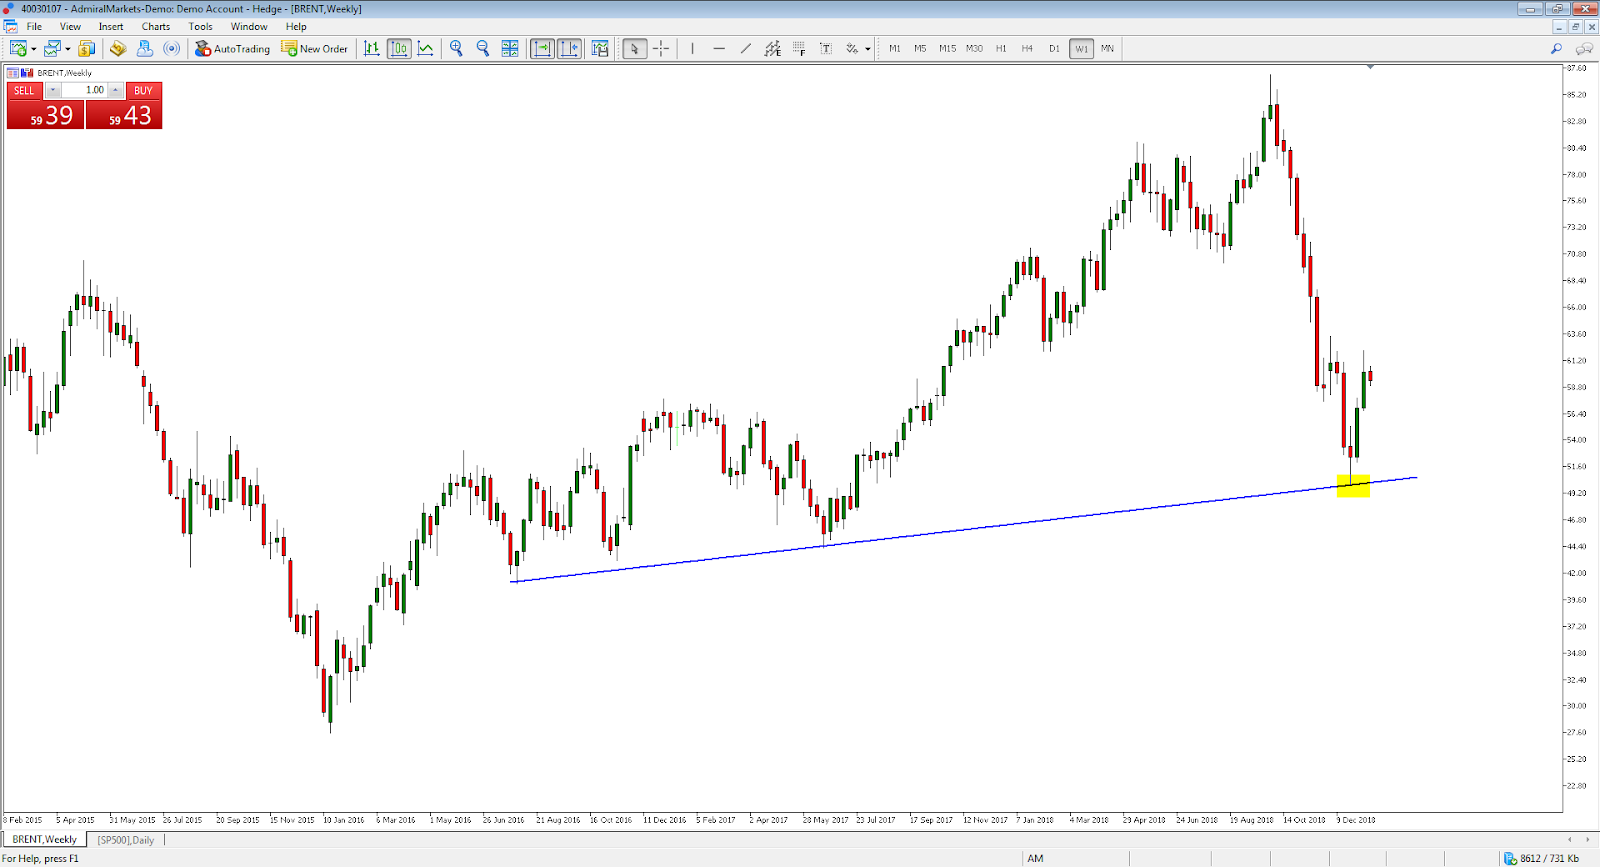
Source: Admiral Markets MT5 Supreme Edition BRENT, Weekly - Data range: from 8 February 2015 - 14 January 2019, performed on 14 January 2019 at 11:32 AM GMT. Please note: Past performance is not a reliable indicator of future results.
In the above chart of brent crude oil, traders could have taken advantage of the bullish situation by looking for long positions off the blue line - typically known as a trend line. These type of lines act as levels of support and resistance and traders often use them to trade against.
However, shorter term traders could have looked at lower time frames for more information on trading opportunities.
(Click on image to enlarge)
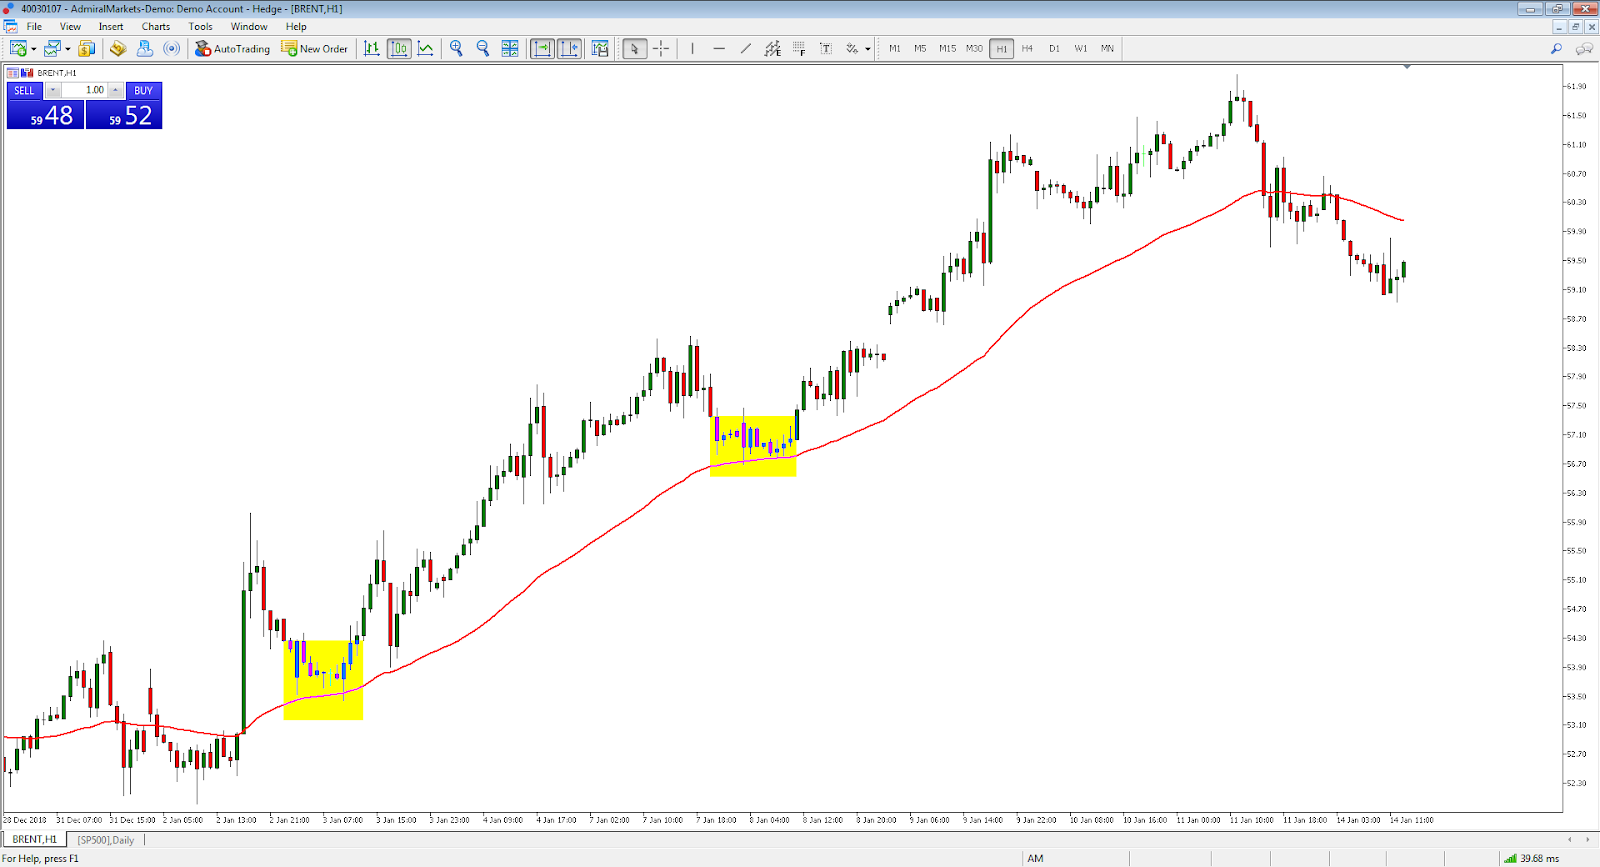
Source: Admiral Markets MT5 Supreme Edition BRENT, H1 - Data range: from 28 December 2018 - 14 January 2019, performed on 14 January 2019 at 11:51 AM GMT. Please note: Past performance is not a reliable indicator of future results.
The above chart shows an hourly chart of the first two weeks of January. Each bar represents one hour of trading. As most traders are looking for higher prices in this market, using trend-based indicators can prove to be very useful.
One of the most simplest yet widely popular trend indicator is the moving average. A 50 period moving average is highlighted by the red line on the chart. This is essentially shows the average price of the last 50 periods. As this line is rising it is showing that buyers are in control.
However, moving averages are also useful as traders and algorithms often buy and sell off them. In this instance traders would now most likely be waiting for the market to trade back above the 50 period moving average before looking at taking new long positions.
How to quickly calculate your profit and loss
Knowing what you stand to make and lose on a trade is essential to the long term success of any trader.
(Click on image to enlarge)
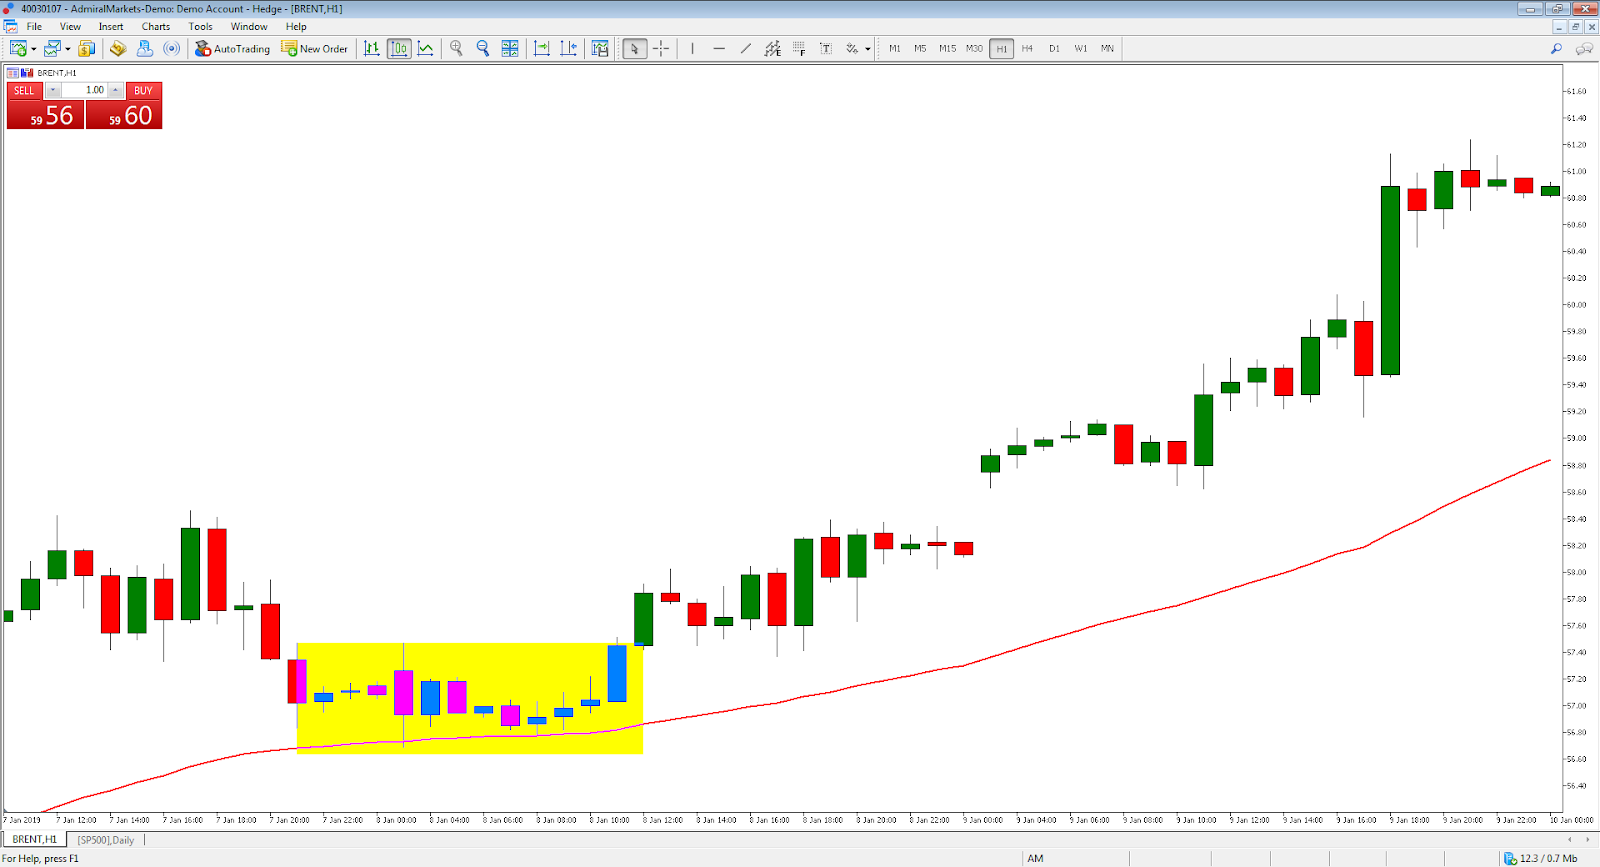
Source: Admiral Markets MT5 Supreme Edition BRENT, H1 - Data range: from 7 January 2019 - 14 January 2019, performed on 14 January 2019 at 12:07 PM GMT. Please note: Past performance is not a reliable indicator of future results.
In the above hourly chart, the price of brent crude entered a short-term range on the 50 period moving average. A possible entry price could have been a break above the trading range at $57.50, with a stop loss the low of the trading range at $56.65. While this is an $0.85 cent difference, what would be the monetary loss trading 1 lot if the entry price was triggered but then the stop loss was hit?
Disclaimer: The given data provides additional information regarding all analysis, estimates, prognosis, forecasts or other similar assessments or information (hereinafter "Analysis") ...
more

