
Oil Price Outlook Mired By Ongoing Oversold RSI Signal
CRUDE OIL TALKING POINTS
Crude remains under pressure as the United States grants waivers on the Iran sanctions in an effort to curb energy prices, and oil remains vulnerable ahead of the weekend as the Relative Strength Index (RSI) stubbornly sits in oversold territory for the first time since 2017.
OIL PRICE OUTLOOK MIRED BY ONGOING OVERSOLD RSI SIGNAL

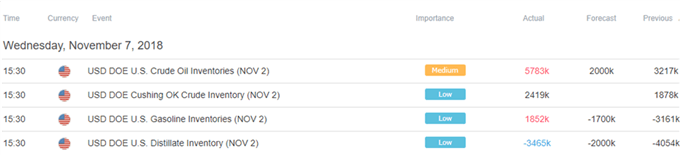
Recent comments from President Donald Trump suggest the U.S. will continue to push for lower oil prices even after the mid-term elections as updates from the Department of Energy (DoE) indicate a further slowdown in demand, with crude inventories jumping another 5783K in the week ending November 2.
In response, the Organization of the Petroleum Exporting Countries (OPEC) may stick to a ‘produce as much you can mode’ especially as the U.S. and China, the two largest consumers of oil, struggling to reach a trade agreement, and the pickup in volatility appears to be fueling a broader change in market behavior amid the ongoing shift in retail interest.
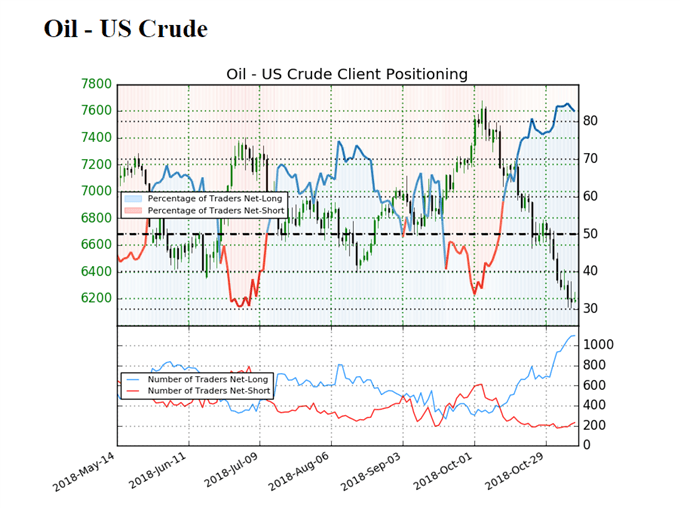
The IG Client Sentiment Report shows 82.6% of traders are still net-long crude, with the ratio of traders long to short at 4.73 to 1.In fact, traders have been net-long since October 11 when oil traded near the $71.00 mark even though price has moved 17.1% lower since then. The number of traders net-long is 0.5% higher than yesterday and a whopping 26.6% higher from last week, while the number of traders net-short is 10.5% higher than yesterday and 6.4% higher from last week.
The persistent accumulation in net-long interest provides a contrarian view to crowd sentiment as traders still attempt to fade the weakness in oil, and the broader outlook warns of a larger correction as crude snaps the upward trend from earlier this year. Moreover, the stickiness in the Relative Strength Index (RSI) warns of further losses as the oscillator continues to track the bearish formation carried over from the previous month and pushes deeper into oversold territory.
CRUDE OIL DAILY CHART
(Click on image to enlarge)
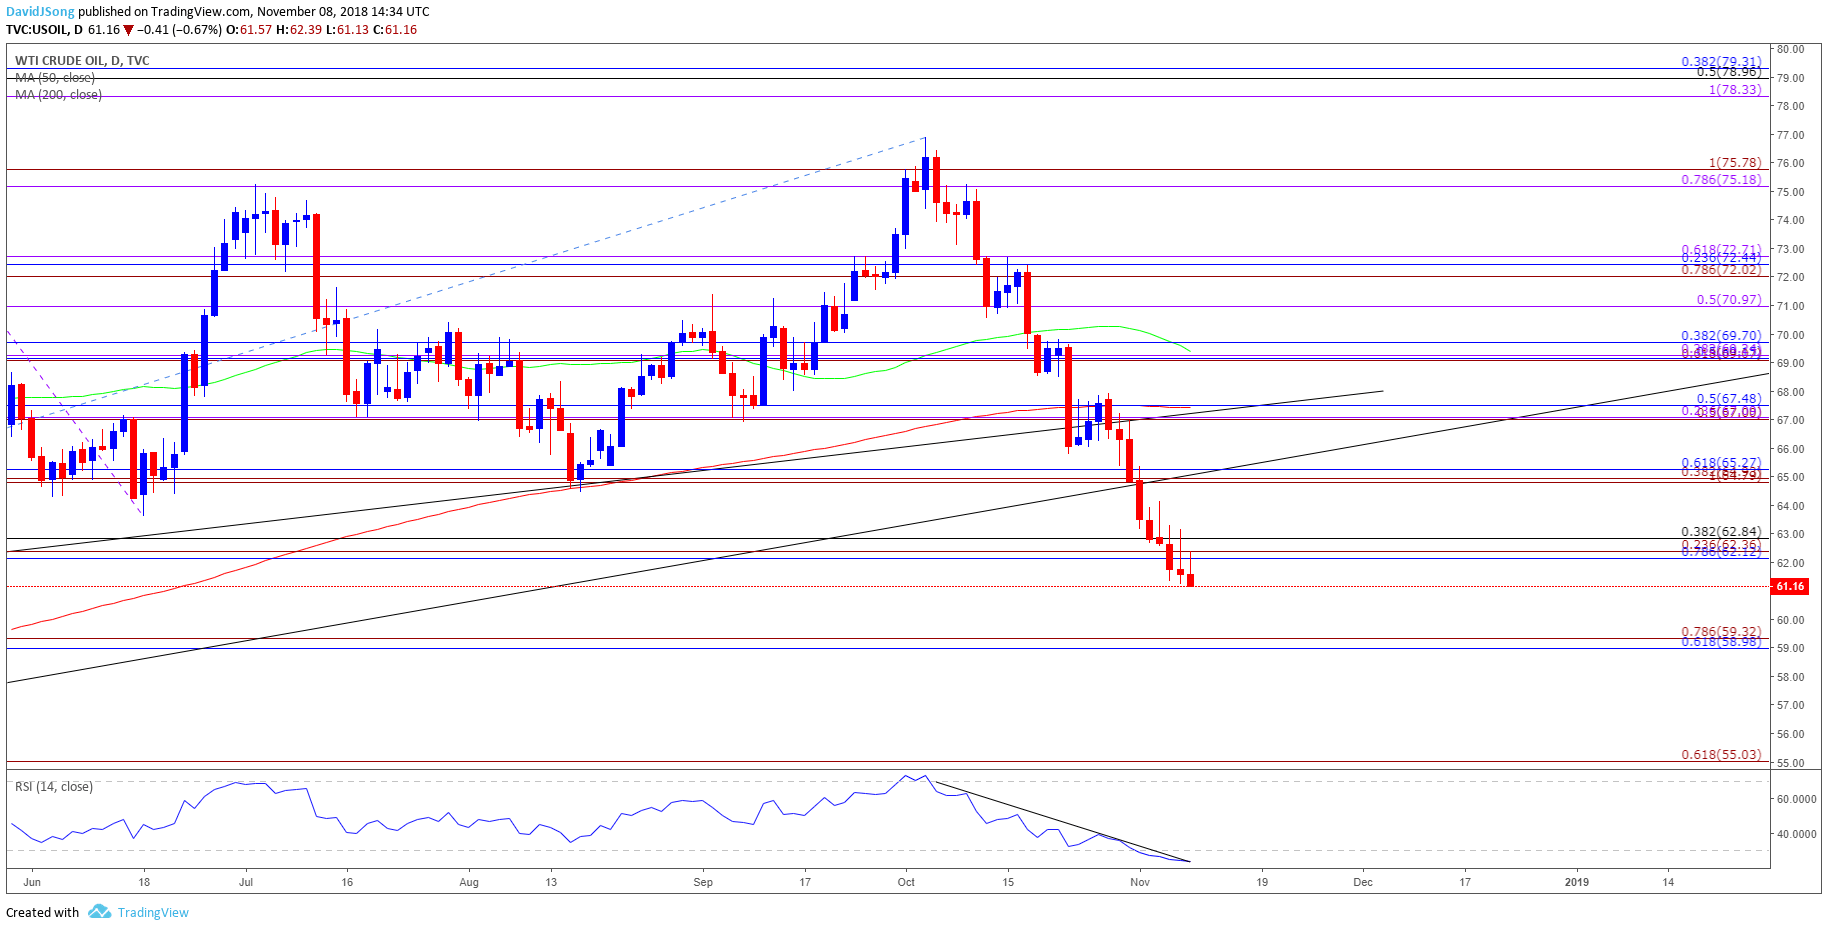
- Downside targets remain on the radar for crude following the break/close below the $62.10 (78.6% retracement) to $62.80 (38.2% retracement) region, with the recent series of lower highs & lows raising the risk for further losses.
- The Fibonacci overlap around $59.00 (61.8% retracement) to $59.30 (78.6% expansion) in now on the radar, which sits just above the 2018-low ($58.11), with the next downside hurdle coming in around the $55.00 (61.8% expansion) handle.
- Will keep a close eye on the RSI as it sits in oversold territory, with the oscillator at risk of flashing a bullish trigger once it snaps the bearish formation and climbs back above 30.
Disclosure: Do you want to see how retail traders are currently trading the US Dollar? Check out our IG Client Sentiment ...
more

