
Oil Price Forecast: Bullish Behavior To Persist As Crude Clears July High
OIL TALKING POINTS
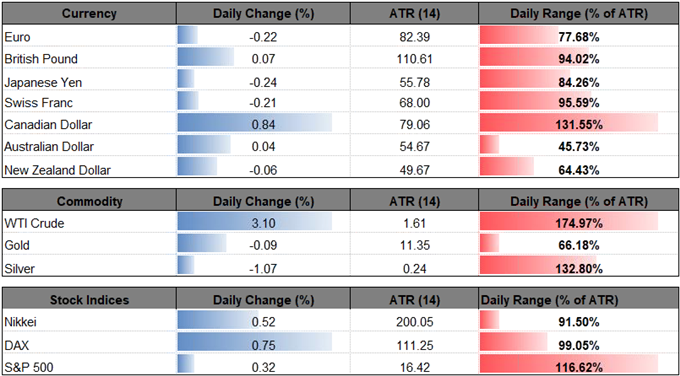
Oil clears the July-high ($75.24) as the Organization of the Petroleum Exporting Countries (OPEC) and its allies show no interest in combating higher energy prices, and crude may continue to exhibit a bullish behavior as it initiates a series of higher highs & lows after breaking out of a narrow range.
OIL PRICE FORECAST: BULLISH BEHAVIOR TO PERSIST AS CRUDE CLEARS JULY HIGH

The economic crisis in Venezuela along with the rebalancing efforts by OPEC and its allies are likely to generate higher oil prices as the group sticks to its current level of output ahead of the next meeting on December 6, and crude may gain ground throughout the second half of 2018 especially as the U.S. sanctions on Iran are slated to take effect from November 4.
(Click on image to enlarge)
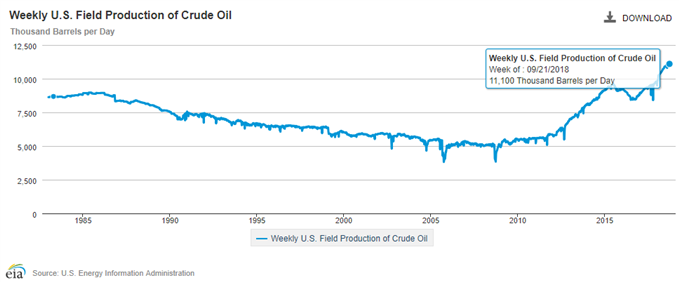
With that said, developments surrounding OPEC and its allies may continue to influence the outlook for oil even as President Donald Trump argues that ‘reliance on a single foreign supplier can leave a nation vulnerable to extortion and intimidation,’ and the recent rebound in U.S. crude output may do little to curb higher energy prices as there appears to be a broader shift in market behavior.
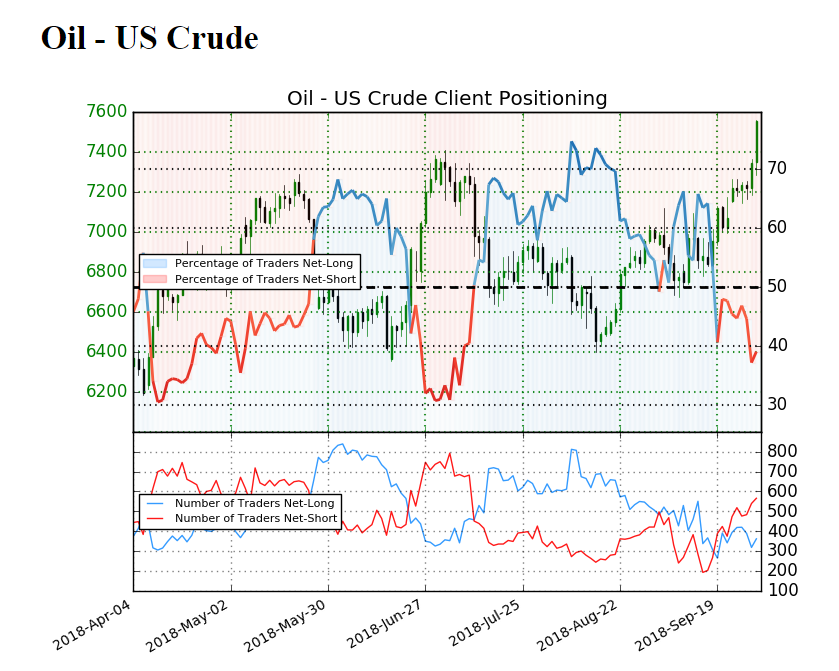
The IG Client Sentiment Report now shows 39.1% of traders are net-long crude, with the ratio of traders short to long at 1.56 to 1. In fact, traders have remained net-short since September 21 when oil traded near $70 even though price has moved 7.6% higher since then. The number of traders net-long is 1.6% lower than yesterday and 0.8% lower from last week, while the number of traders net-short is 6.4% higher than yesterday and 16.9% higher from last week.
The recent shift in retail position provides a contrarian view to crowd sentiment, which looks poised to persist over the near-term, with recent price action raising the risk for fresh yearly highs in crude especially as the Relative Strength Index (RSI) suggests the bullish momentum is gathering pace. Interested in having a broader discussion on current market themes?
Oil Daily Chart
(Click on image to enlarge)
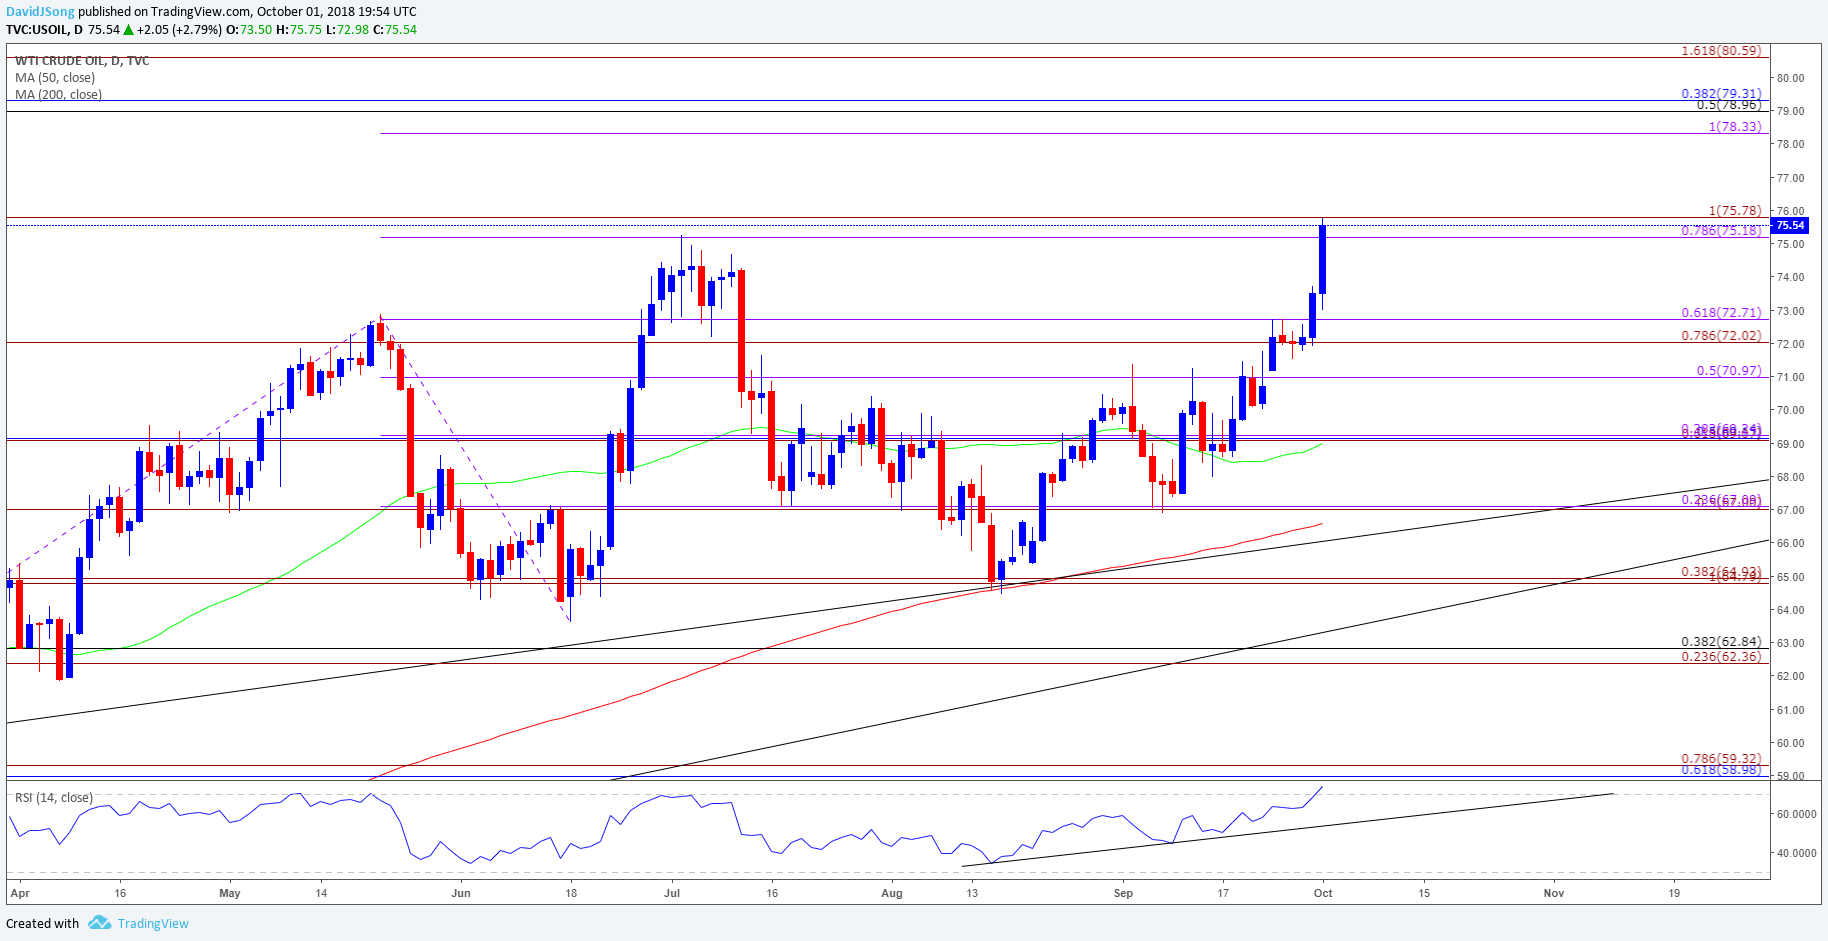
- Keeping a close eye on the RSI as recent developments in the oscillator suggest the bullish momentum is gathering pace as the indicator breaks above 70 and pushes into the overbought territory; may see the former-resistance zone around $71.00 (50% expansion) to $72.70 (50% expansion) now offer support.
- Need a break/close above the $75.20 (78.6% expansion) to $75.80 (100% expansion) region to favor a larger advance, with the next region of interest coming in around $78.30 (100% expansion) to $79.30 (38.2% retracement).


