
Oh Canada! A Cold Wind Blows From The Great White North
I am rushing this to you ahead of publication schedule as the message is both urgent and important. The great risk to the world’s economic system is that of a credit contraction. Western and Asian economies are ill, equipped to absorb economic shocks as a result of their level of debt saturation. No one knows where such a shock will come from, but we have postulated China or even Canada. Recently Home Capital Group of Canada has suffered a full-blown bank run and is in financial duress. Is this significant? Most would say no, however when we look at the charts of Canada’s biggest banks we see smoke billowing out. Something is wrong here.
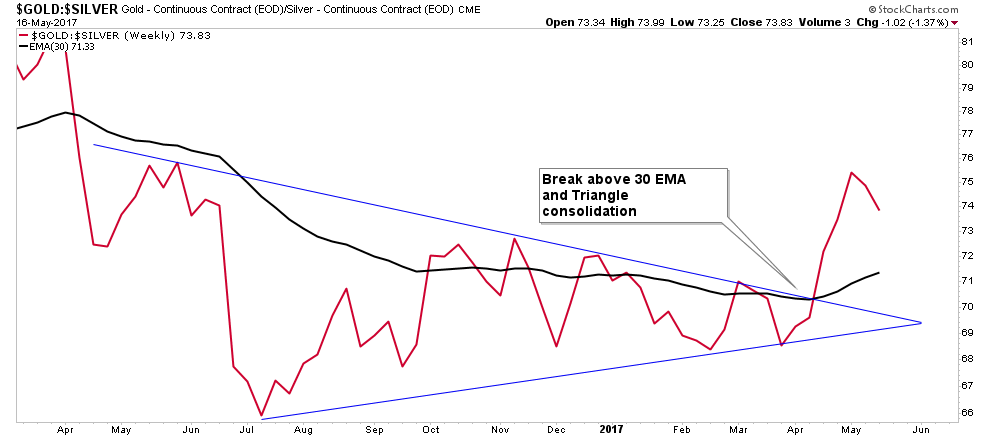
Gold Silver Ratio-Metalic Credit Spread
The gold silver ratio has recently triggered an early warning signal. It is indicating financial stress in the future, most likely coming in the fall of 2017. By spiking and exceeding its trend high it is indicating credit troubles ahead. Note the clear break out of its consolidation triangle and the 30 EMA. Credit problems clear themselves in the fall and the GSR is indicating there is trouble ahead in the form of a credit contraction.
(Click on image to enlarge)
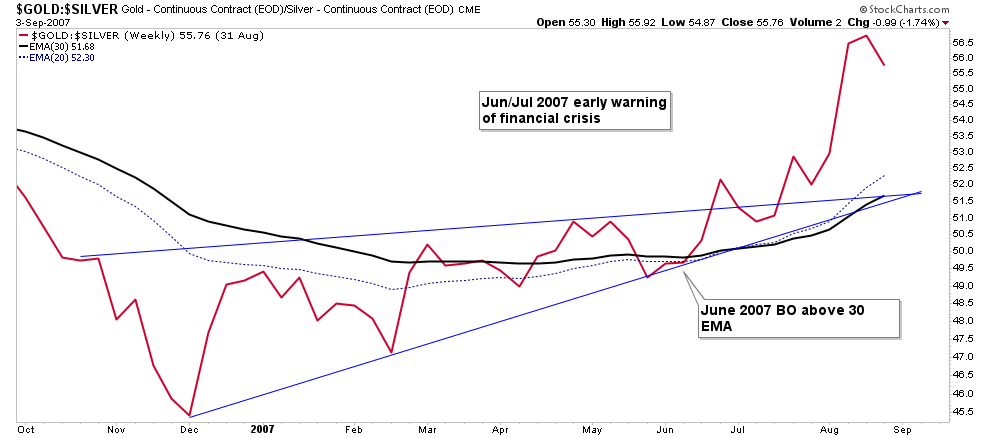
Note how the GSR provided an early warning of the market top in Oct 2007 and the credit crunch which started before that. We will see that financial stocks began falling 7 months before the market peaked which is what the GSR was signaling.
(Click on image to enlarge)
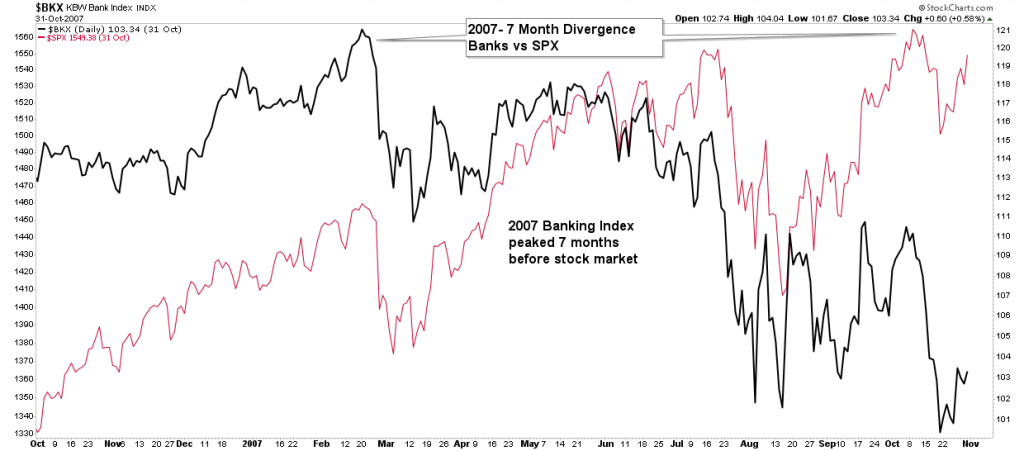
Financials vs General Index- Divergence at the top.
Back in 2007 the banks stock index peaked 7 months before the general indexes. This is what the GSR was indicating. We see it here in the below chart of the banks vs the SPX
(Click on image to enlarge)
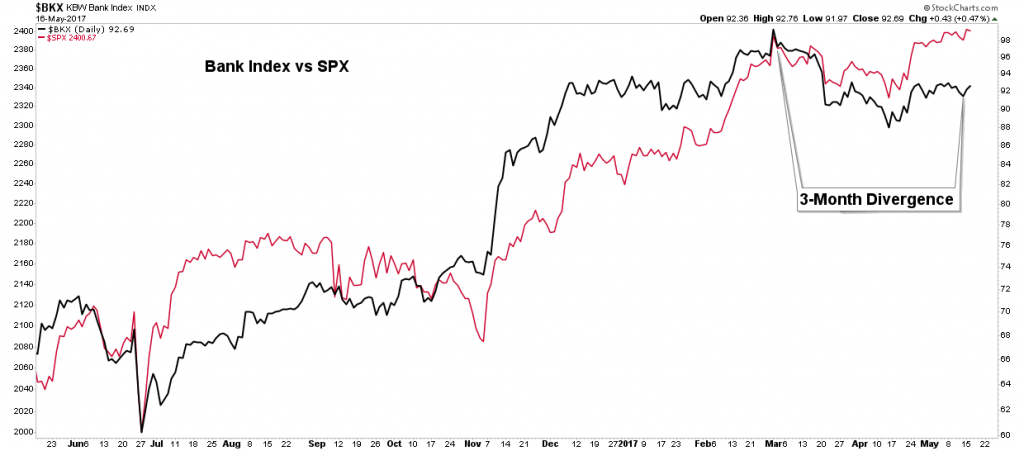
Today we see that the bank stocks appear to have peaked 3 months ago and are putting in a divergence to the SPX. Is this what the GSR today is forecasting?
(Click on image to enlarge)
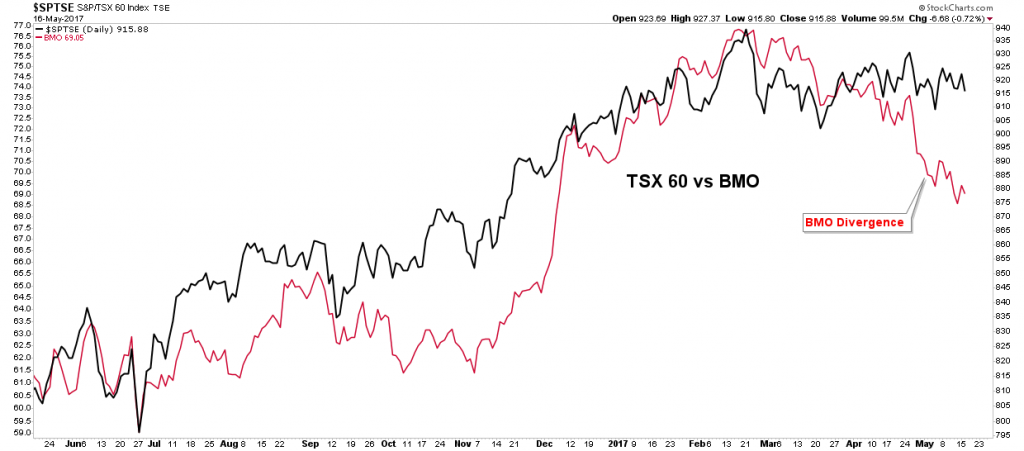
Next, we view what’s going on in Canada. I am using Bank of Montreal as a proxy for the sector since it is the Blue Blood bank of Canada vs the TSX 60. What we see here is a clear break from the index. Is Canada blowing a cold wind of credit contraction our way?
(Click on image to enlarge)
Now let’s look at the major banks of Canada. We will look first at the weekly chart then the daily. Note how they all are pretty close to the same. They have all broken down and are transmitting a message in unison that there is something seriously wrong. Talk about a bull trap, all these charts put in spectacular arching highs after they broke their preceding high print back in 2014. These are all extraordinarily ugly tops with ensuing violent initial declines . Be sure to look at how the previous tops extended line (blue) interacts with the H&S tops that then developed. The extended line acts as a neckline in most cases. Let’s take a look.
The Bank Of Montreal
What a well formed H&S top with its NL placed right at the previous high. This institution is the Blue Blood Bank of Canada. This isn’t supposed to happen. It had a nice double bottom and when it broke its previous high it should have kept going. This chart shouts out there is trouble brewing beneath the surface.
(Click on image to enlarge)
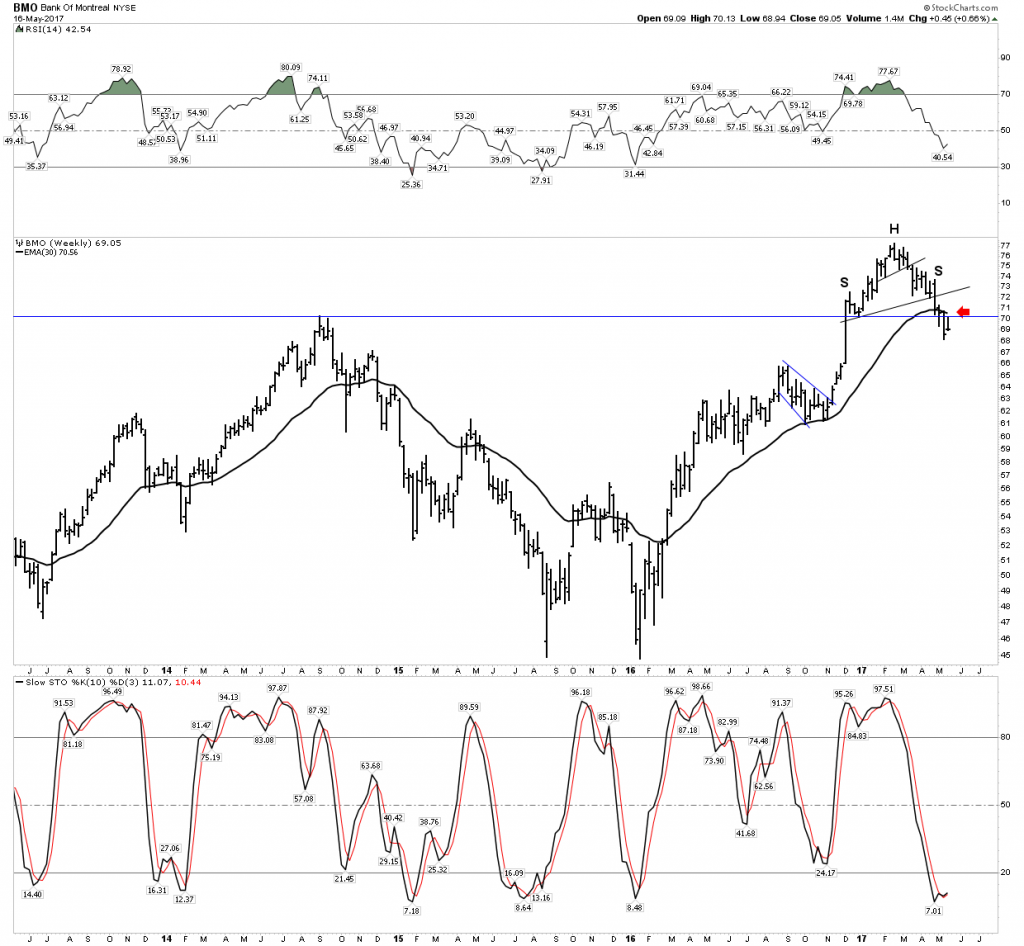
The 30 EMA is now bending downward and has contained the price action on the way up. Will it serve the same function on the way down?
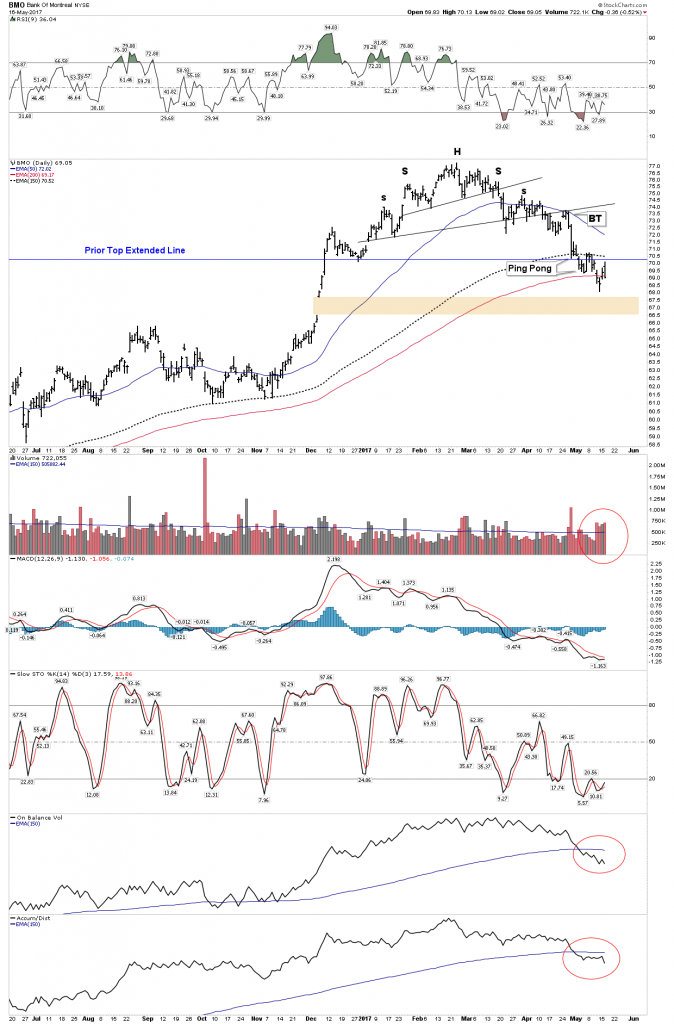
The daily has ugly written all over it. Check out that extended prior top line. Price is currently flirting with the 150/200 EMA ping-ponging up and down. Note the volume churning action and OBV as well as Accum/Dist indicates heading for the exits.
(Click on image to enlarge)
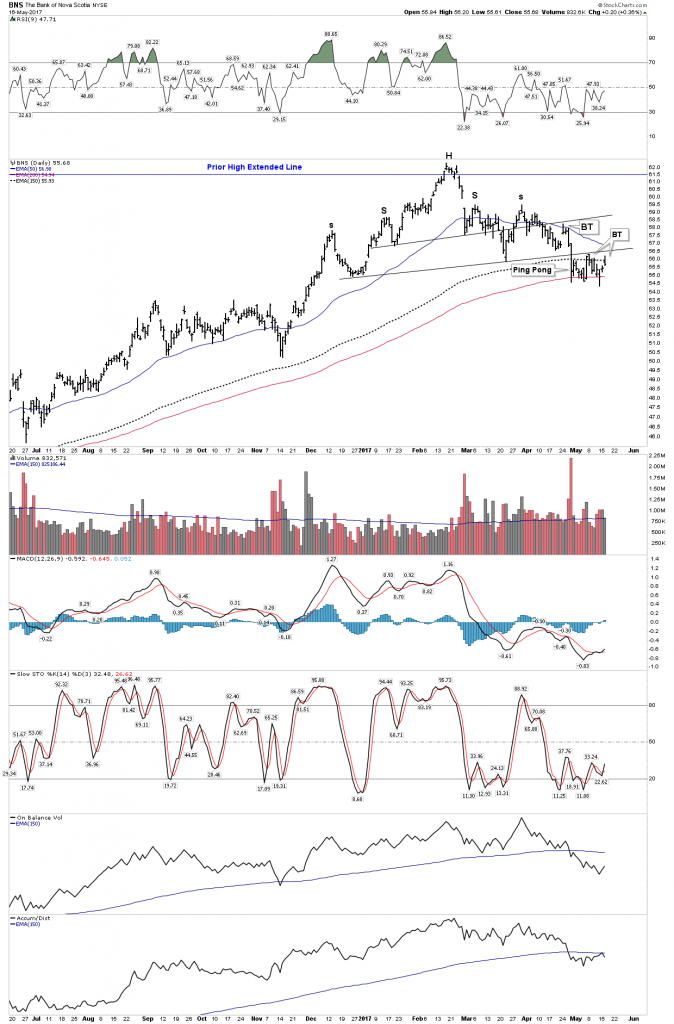
Bank of Nova Scotia
This bank is also a very well healed institution. There is a lot of old family money in Nova Scotia. A lot of resource financing comes from these people. But this chart is also announcing something wrong here. Note the second top could only just peek above the previous high. It has built out a clear H&S and has broken it and is in the BT phase underneath a declining 30 EMA of course.
(Click on image to enlarge)
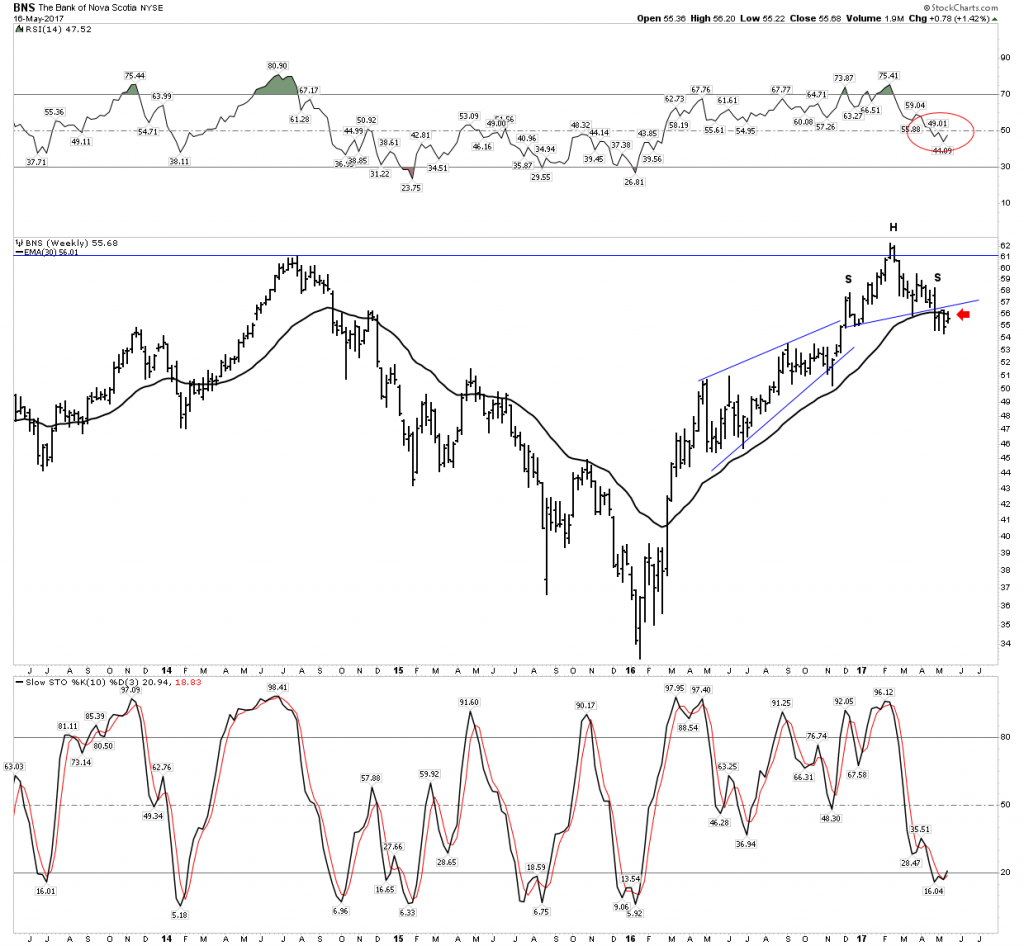
The daily makes it clear that this chart is living on borrowed time. It could only close above that prior peak for 4 closes before it gave up. It’s been in BT mode below NL 2 for 14 trading days now... The candles burning, how long do you think it can defy gravity?
(Click on image to enlarge)
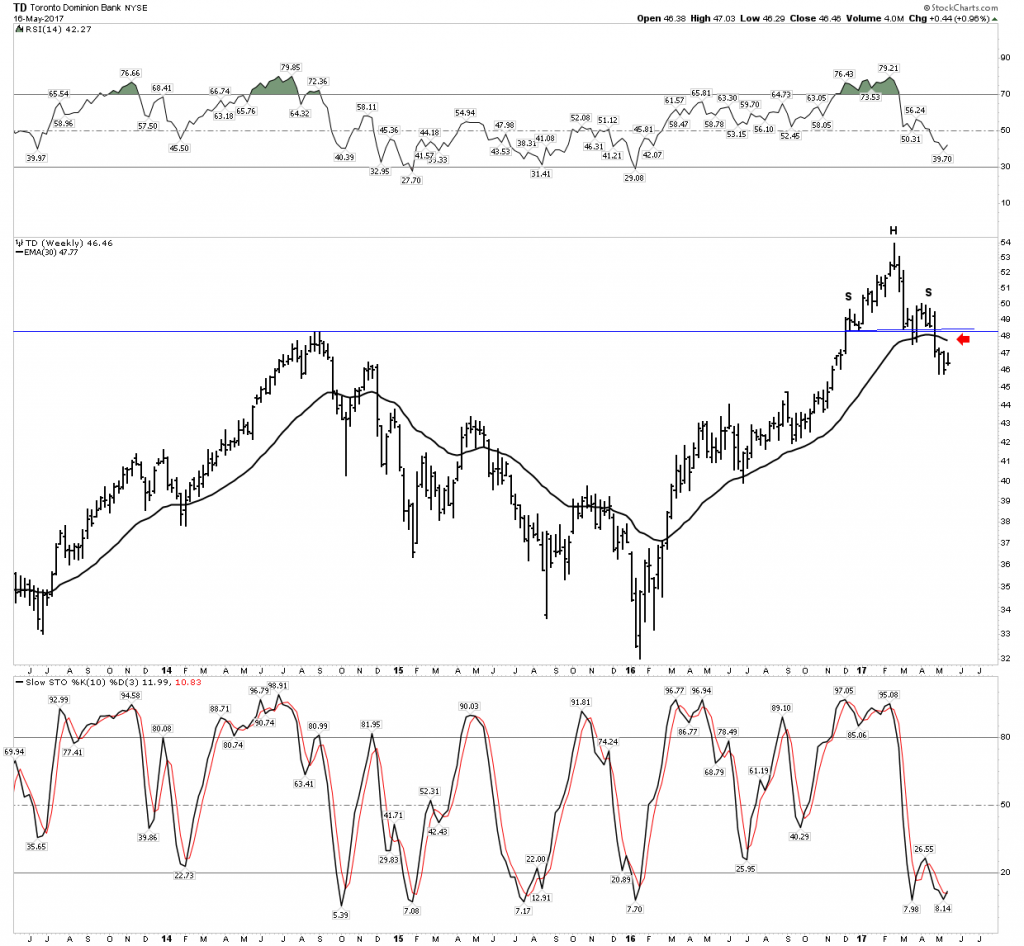
Toronto Dominion Bank
Solid as a rock as they say. That’s what one imagines when he thinks of TD Bank. I opened my daughter's brokerage account with TD Ameritrade because I view the bank as so solid. But what we have here is another spectacular failure above the previous high. This one actually uses the previous high as its neckline, not very original or I guess the ultimate S&R level. No broadening top on this one just a violent crash down through support. What’s this all mean?
(Click on image to enlarge)
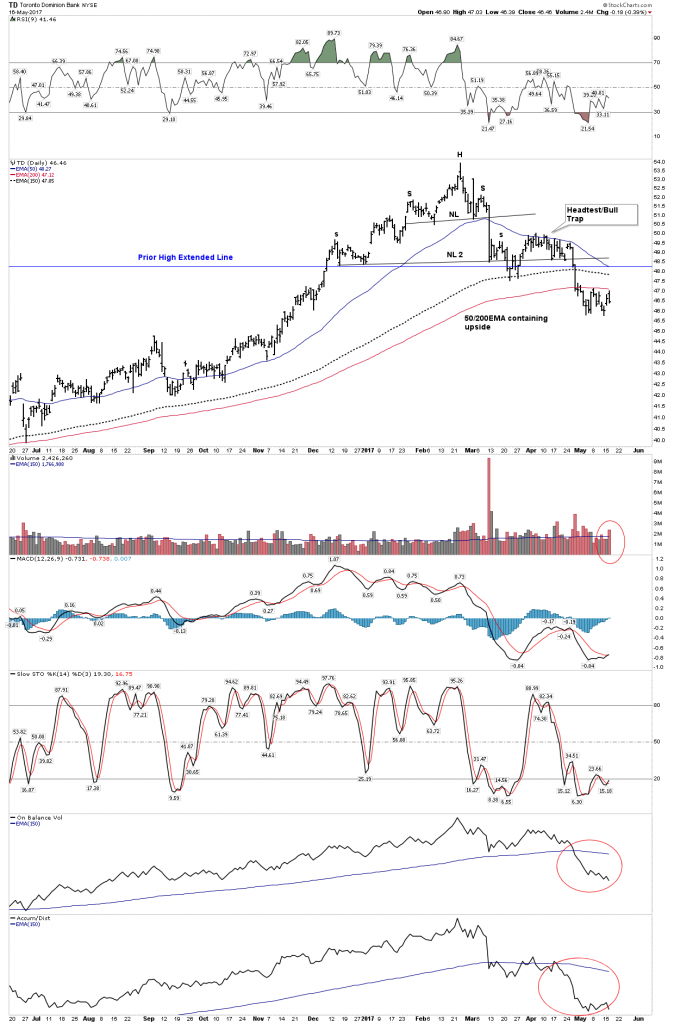
OMG talk about borrowed time! This chart is simply painful to look at. For anyone who doesn’t think that 50/200 EMAs are significant show them this chart. See how those averages have contained price since we started down. Now tucked up under the 200 EMA, how long until it gives it up?
(Click on image to enlarge)
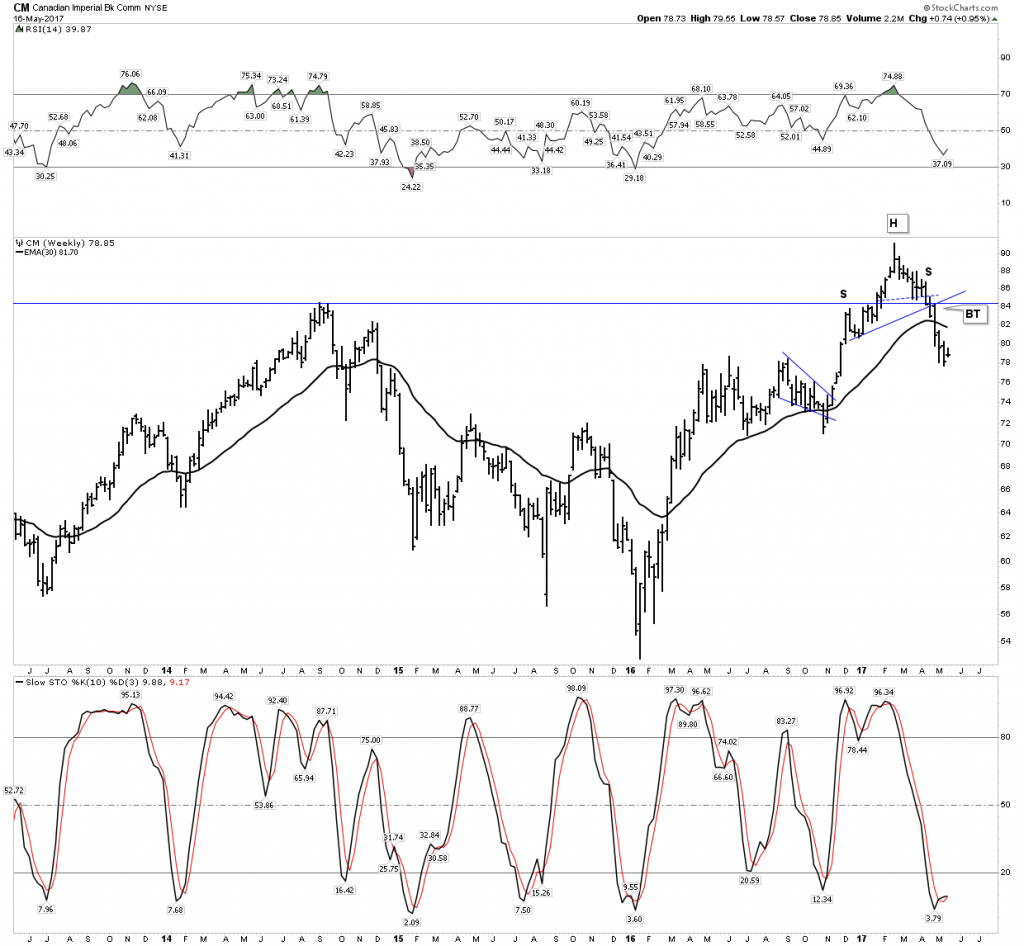
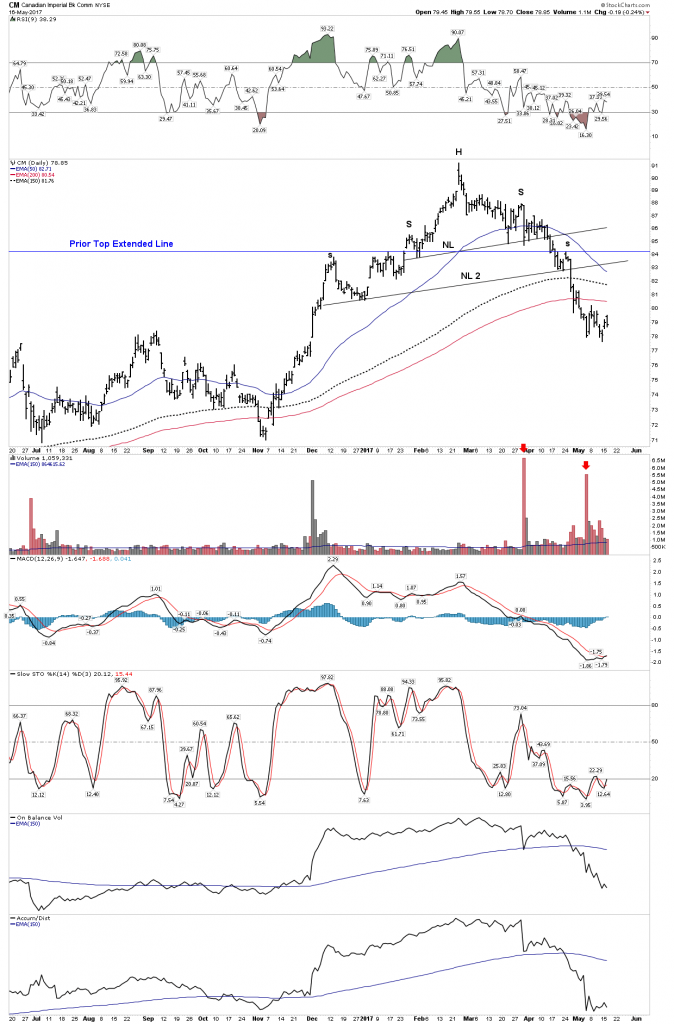
Canadian Imperial Bank CIBC
Haven’t heard of them? Where have you been?CIBC was named the strongest bank in North America and the 3rd strongest bank in the world, by Bloomberg Markets magazine. So they are first stringers obviously, but the chart is saying somethings wrong here too. Now well below its 200 EMA and all averages in decline mode. Don’t miss those volume spikes.
(Click on image to enlarge)
150/200 EMA rollover:
(Click on image to enlarge)
So what’s the bottom line here? I think the language of the market is telling us that a bear market has begun up there in the great white north. The financial sector is sniffing it out. When governments become so complacent that they kick out the beams of support from their bubble real estate market by slapping on a 15% foreigners tax these things can unravel quickly. We got the early warning from the GSR and the financial stocks to these big powerful banks are separating themselves from the TSX index. This appears to be no “mid-course” slow down this looks to be the real McCoy….er real Mackenzie.
But there is good news. The good Prime Minister Mr. Trudeau has promised to ease your pain if real estate is collateral damage to any credit crunch by legalizing reefer madness by July.
Disclosure: None.


