
Of Sugar Highs, Uncertainty, And Recession
Growth is already slated to decelerate, but in the absence of the Tax Cuts and Jobs Act, it might have decelerated even more; on the other hand in the absence of crazy high policy uncertainty, growth might have been faster…
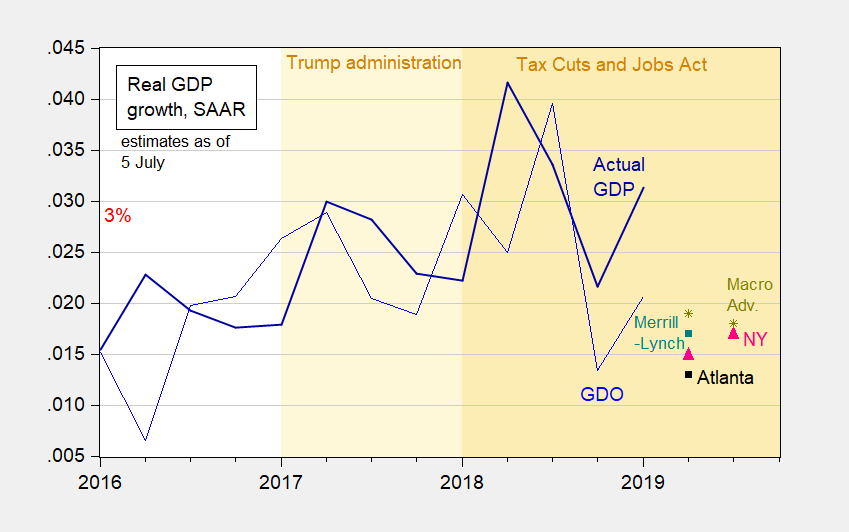
Figure 1: Real GDP growth as reported (dark blue), GDO (blue), Atlanta Fed GDPNow (black square), NY Fed Nowcast (pink triangle), Macroeconomic Advisers (chartreuse *), Merrill-Lynch (teal square). Source: BEA 2019Q1 3rd release, all forecasts as of July 5, except for NY Fed (July 3), and author’s calculations.
What is the Trump factor in all this. The Tax Cuts and Jobs Act is the signature legislative accomplishment of the Trump era. Goldman Sachs’s estimated the impact of the TCJA on GDP as follows:
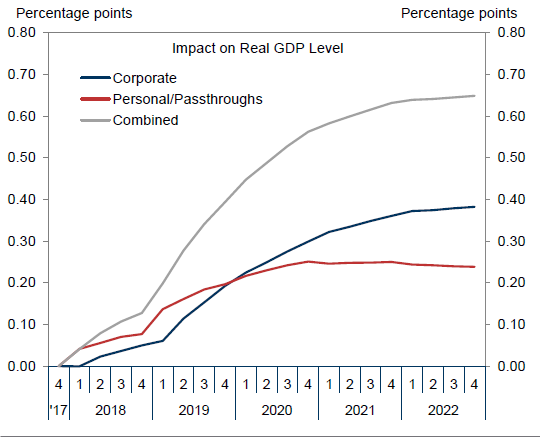
Source: Phillips, Mericle, “US Daily: Tax Reform Through the Eyes of the Fed,” Goldman Sachs Economic Research, 5 December 2017.
If these estimates are correct, then we can back out an implied counterfactual GDP path that does not incorporate passage of the TCJA. This is shown in Figure 2 (where I have used the Macroeconomic Advisers’ forecasts through 2019Q3).
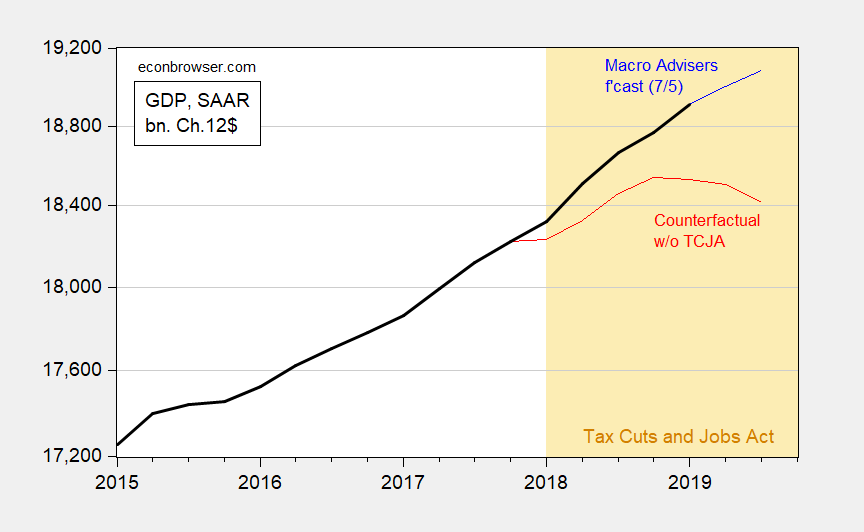
Figure 2: GDP as reported (black), as forecasted by Macroeconomic Advisers (blue), and counterfactual w/o TCJA passage (red) all in billion Ch. 2012$ SAAR. Source: BEA 2019Q1 3rd GDP release, Macroeconomic Advisers July 5, 2019 forecasts, and estimates from Goldman Sachs of TCJA impact, and author’s calculations.
Obviously, the counterfactual is contingent upon the estimates of the TCJA impact. I myself believe the impact is likely smaller than the GS estimates (see Congressional Research Service report) given that their estimates implied a big boost to equipment investment growth, while 2019Q1 equipment investment declined 1% (SAAR).
The decline in equipment investment suggests that the Trump factor includes other components; one highlighted in my previous discussions is heightened economic policy uncertainty.
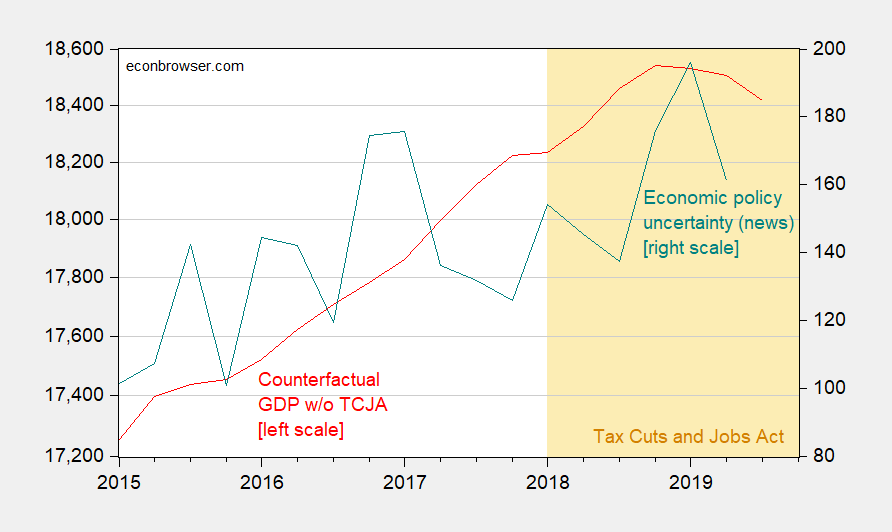
Figure 3: GDP counterfactual w/o TCJA passage (red, left log scale) in billion Ch. 2012$ SAAR, and economic policy uncertainty index (teal, right scale). Source: BEA 2019Q1 3rd GDP release, Macroeconomic Advisers July 5, 2019 forecasts, and estimates from Goldman Sachs of TCJA impact, policyuncertainty.com and author’s calculations.
The decline in counterfactual GDP coincides with the elevation of economic policy uncertainty. And that phenomenon has much to do with Mr. Trump.
(See this post which calculates a counterfactual recession probability holding economic policy uncertainty at Obama levels.)
Disclosure: None.


