
Odds Favor Shorts Near-Term If S&P 500 Rallies To 2800+
Post-Powell’s supposed dovish switch last week, equity bulls spent lots of energy to rally the S&P 500 within less than two points of the 200-day. If the trade-tariff truce the US and China reached over the weekend in Argentina is viewed favorably and the index rallies to 2800, shorts are likely to get aggressive.
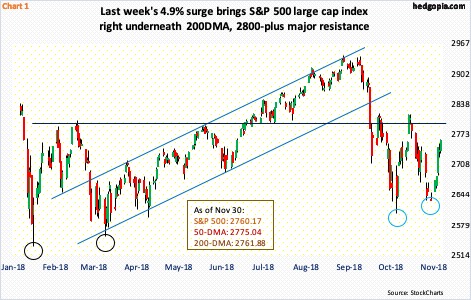
Jerome Powell, Fed chair, kicked off a powerful rally in stocks last week. His Economic Club of New York speech on Wednesday was viewed as dovish. Early October – on the 3rd to be precise – he said interest rates were still “a long way” from neutral. In that very session, the S&P 500 large cap index began its waterfall dive. By October 29, it was sown 11.4 percent (Chart 1).
When Powell made that comment, stocks, in general, were deeply overbought and were looking for a reason to sell off. He provided one. With three 25-basis-point hikes already in the bag this year and a hike in December (18-19) all but certain, markets concluded the Fed was on its way to tightening a lot more than they had priced in. The FOMC dot plot expects three more hikes next year.
Come last Wednesday, Powell supposedly did a U-turn. He said rates were “just below” the neutral range. An oversold equity market interpreted this as a shift downward in his prior hawkish stance. Last week, the S&P 500 (2760.17) jumped 4.9 percent.
Is Mr. Market correct in its assessment? Let time be the arbiter of that.
We do know this. Although not a whole lot has changed between October 3 and November 28, US macro data have been in deceleration. If anything, the trend has gotten more entrenched of late.
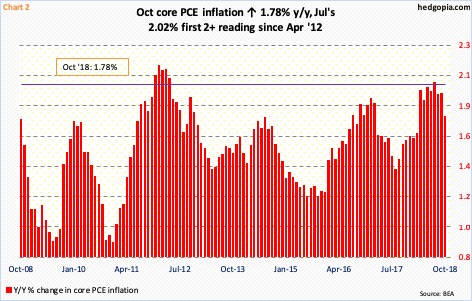
In the 12 months to October, core PCE – the Fed’s favorite measure of consumer inflation – rose 1.78 percent, an eight-month low. As recently as July, it rose 2.02 percent, which was the first two-plus reading since April 2012 (Chart 2). The Fed has a two-percent target on inflation. Other data, such as ISM manufacturing and GDP, are similarly softening.
In October, US manufacturing dropped 2.1 points month-over-month to 57.7 (November’s numbers are due out later this morning.) August’s 61.3 was the highest since 61.4 in May 2004. It is awfully hard to sustain north of 60. Likewise, real GDP expanded 4.2 percent in 2Q18 – a 15-quarter high – followed by 3.5 percent in 3Q. As of November 29, the Atlanta Fed’s GDPNow model forecasts 2.6-percent growth in 4Q.
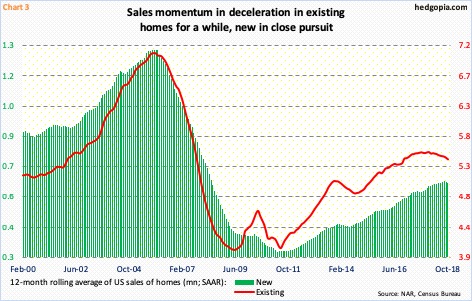
The decelerating trend in housing, in particular, is worrying. Sales of both existing and new homes are rolling over. The trend is particularly evident in the former, and the latter seems to be catching up.
In October, sales of new homes declined 8.9 percent m/m to a seasonally adjusted annual rate of 544,000 units, while existing rose 1.4 percent m/m to 5.22 million (SAAR). They have both been in decline since reaching cycle highs in November last year – 712,000 and 5.72 million, respectively.
Chart 3 smooths out monthly fluctuations by calculating a 12-month average, and the trend is clear, particularly in existing. The supply of new homes in particular is on persistent upward trend – 7.4 months in October versus 4.9 in November last year.
Macro deceleration or not, medium- to long-term, stocks have their backs against the wall. Kind of a ‘heads I win, tails you lose’ situation. In a scenario in which the economy accelerates – not a base case on this blog – the fed continues to tighten. The expansion is into its 10th year. In a leveraged economy, it does not take long before higher rates begin to seriously bite. If, on the other hand, the economy continues to downshift, it is a no-brainer. In both scenarios, earnings will be impacted – adversely.
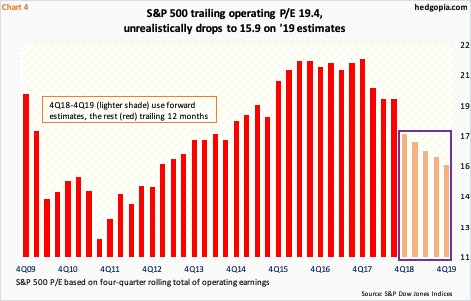
Next year’s estimates remain elevated. Post-tax cuts of last December, the sell-side aggressively raised estimates. This year’s operating earnings estimates for S&P 500 companies went from $145.31 on December 21 to $158.26 on November 7, with $157.73 at the end of last month. Next year’s estimates have come under slight pressure since August 3 when they peaked at $177.13, with end-November at $174.01. As things stand, after this year’s expected 26.7-percent jump, earnings are expected to jump another 10.3 percent next year. There is a lot of good news priced into these estimates. Softer macro data can act as a curveball. On next year’s estimates, the S&P 500 trades at sub-16 multiple (Chart 4), but it is hard to trust.
Hence the confusion among market participants.
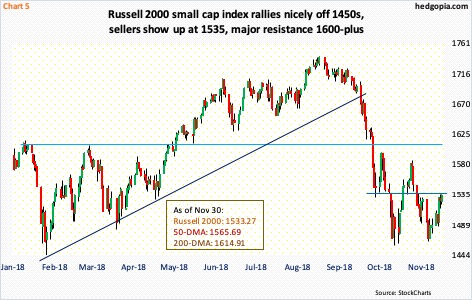
Last week, small-caps did not fare very well – relatively, that is (Chart 5). The Russell 2000 small cap index rallied (1533.27) was up three percent, against a massive 6.5-percent surge in the Nasdaq 100 index. Traders tend to gravitate toward these indices when mood has shifted to risk-on. Even in this seasonally favorable period, the signal is mixed.
From small-cap bulls’ perspective, the good thing is that last week’s rally preceded defense in the prior week of 1450-ish (Chart 5). This support goes back 16 months. They would have massively improved their odds near-term if they recapture 1535. In fact, using a measured-move-target approach, a box breakout can eventually result in a test of 10-month horizontal resistance at 1600-plus, which is where the 200-day (1614.91) rests.
It is probably not a coincidence that going into the G-20 meeting major indices closed out the week near technically important levels – the S&P 500 right underneath the 200-day, the Russell 2000 just below 1535 and the Nasdaq 100 less than a point south of 6950. Depending on how markets view the trade truce between the US and China, a breakout is as possible as reversal lower from these levels. How things proceed today will be telling. If a rally unfolds, there is decent chance of short squeeze.
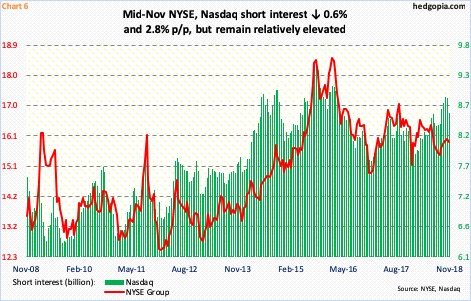
Short interest remains relatively elevated, particularly on the Nasdaq (Chart 6). In fact, it is possible last week’s rally already caught shorts off-guard. Many traders view the 200-day as a bull-bear line. So if it is recaptured on the S&P 500, many shorts likely give in, at least initially. Then comes the next battle line – 2800, or just north of it. Since the index sold off in January-February this year, this level has proven significant, including mid-October and early last month when selling accelerated at that level. This likely occurs again – at least near term. How things transpire in the next few sessions will tell us a lot. Until then, it is a wait and watch.
Disclaimer: This article is not intended to be, nor shall it be construed as, investment advice. Neither the information nor any opinion expressed here constitutes an offer to buy or sell any ...
more

