
October 2019 Yield Curve Update
The yield curve still seems to be following the bearish timeline. My axioms here are:

1) The true measure of inversion isn't a slope of zero. At the zero lower bound, it is a slope of a little more than 1% (10 year minus Fed Funds), which declines as the base yield rises. (At about 5%, meaningful inversion happens at a slop of zero, and higher than that, the slope will tend to become more negative the higher yields are.)
2) The neutral rate is a moving target. If the Fed drops its target rate too slowly, long term rates will tend to stabilize but not rise, and this usually ends in some sort of contraction. If the Fed gets ahead of the dropping short term rate, then long term yields will pop up like they did a couple of times in the 1990s, and contraction will be avoided. So, if the scatterplot keeps moving to the left as it did this month, that's bearish. If it moves up, that's bullish.
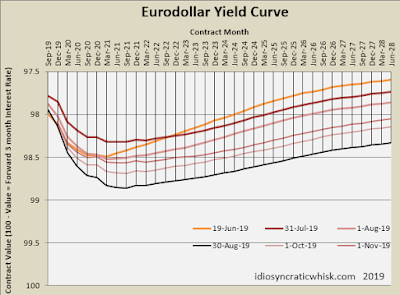
The second graph is the Eurodollar yield curve, which continues to move up and down a bit but with a negative short term slope and a pretty flat long term slope. I expect the short end of this curve to eventually drop below where it was in late August. It will be good news if it doesn't.


