
Observations On The E-Mini S&P 500
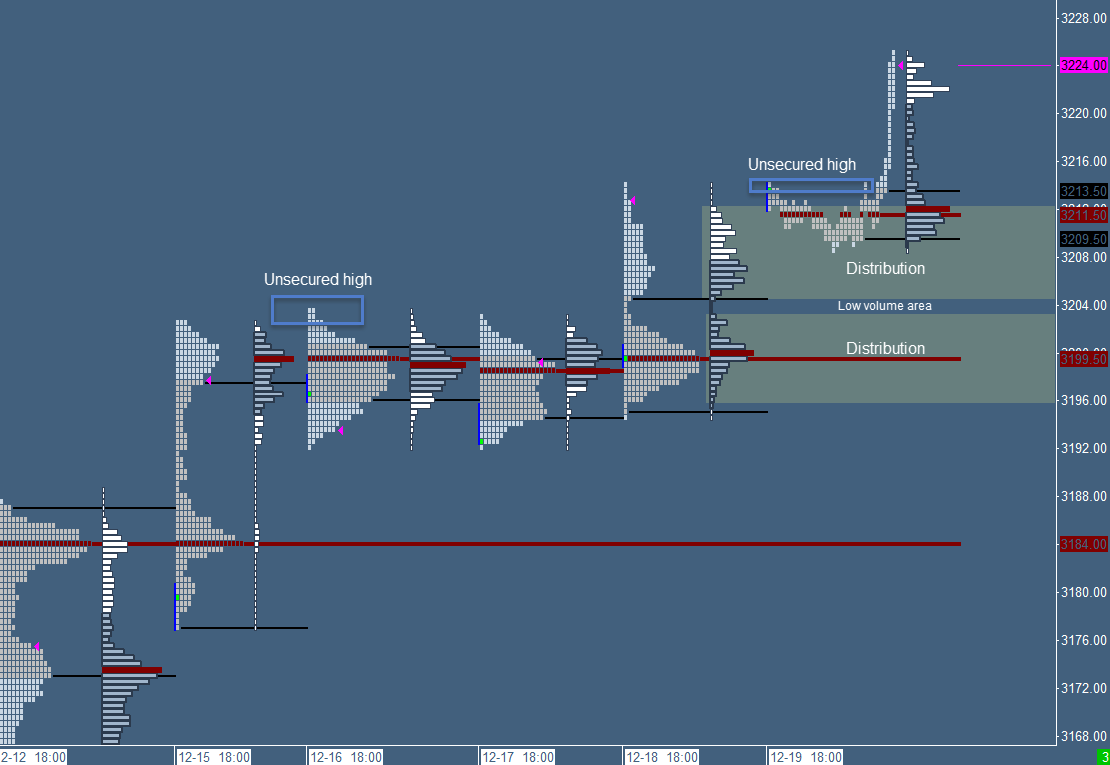
After the two-day balanced behavior, the market broke out to explore new highs. With this surge to higher prices the mentioned unsecured high got taken out and has been cleared. Looking at the current daily TPO structure we can observe a double distribution profile. Volume distributions are areas in which the market was balanced and accepted a particular price range. The extremes of these distributions are possible areas of support or resistance and serving as an area of confluence. Today the market opened above the previous value close area and above the upper distribution which gave us the first indication of possible bullish behavior in the early morning. Additionally, it created another unsecured high which is a sign that the market could revisit in order to clear it.
(Click on image to enlarge)
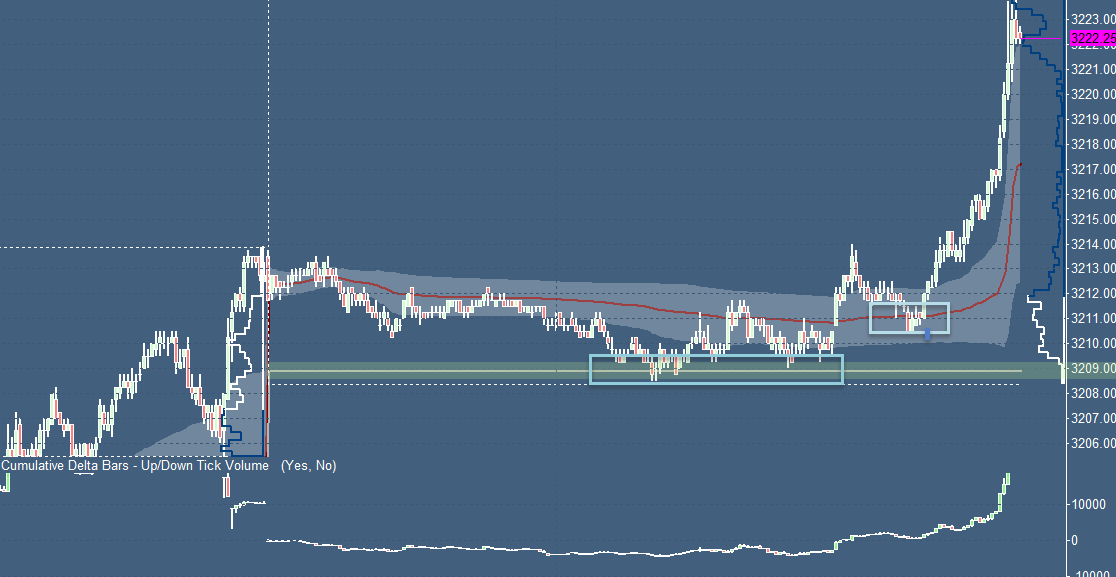
Moving forward with this market generated information to the daily VWAP structure we can identify the trade level. The market opened above the previous value close area (area between the 1. Standard Deviation levels) and we're testing the VAH close level. In combination with the absorption on the Footprint chart we were able to identify this particular level as a possible trade location. The market was able to find support and to move back into the developing value area of the VWAP. Later we were able to observe the rest of the unsecured high with a pullback to the developing VWAP in order to scale in and out (or to add to the position).
(Click on image to enlarge)
This is a purely technical point of view and is only an intra-day perspective. For a swing trade thesis, we using higher time frame analysis with monthly and weekly profile and VWAP perspectives to identify the path of least resistance and to plan a short to long-term trade.
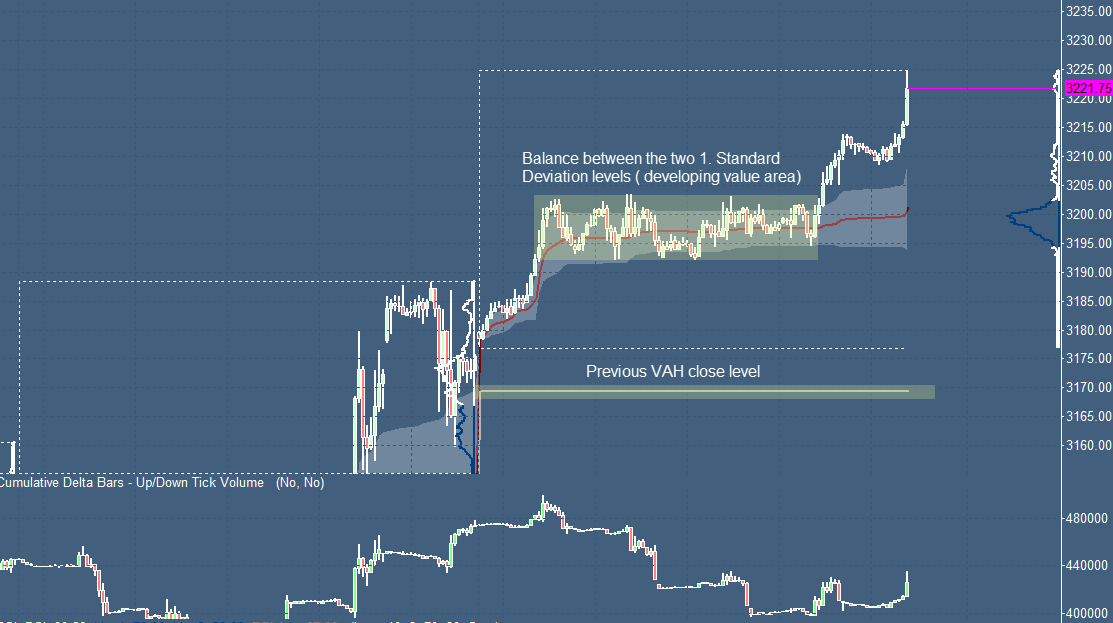
Here a screenshot of the weekly VWAP perspective. The market trades above the previous value close area and above the developing value area. The market surged higher after a two-day rotational behavior between the two 1. standard deviation levels which represent the developing value area of the VWAP:
(Click on image to enlarge)
Please visit our trading community to learn a more indepth analysis process with various tools such as the VWAP or Footprint ...
more

