
NZD/USD Tests Former Support Ahead Of Federal Reserve Minutes
NZD/USD attempts to retrace the sharp decline from the previous month after defending the February low (0.6943), with the RSI highlighting a similar dynamic as the indicator breaks out of a downward trend following the failed attempt to push into oversold territory.
However, the broader outlook remains mired by a head-and-shoulders formation as NZD/USD snaps the yearly opening range in March, and it remains to be seen if the Federal Open Market Committee (FOMC) Minutes will influence the exchange rate amid the limited market reaction to the US Non-Farm Payrolls (NFP) report.

In turn, the transcript of the Fed’s March meeting may keep the key reversal pattern in play even though the central bank stays on track to “increase our holdings of Treasury securities by at least $80 billion per month and of agency mortgage-backed securities by at least $40 billion per month,” and the rebound from the March low (0.6943) may continue to coincide with the pullback in longer-dated US Treasury yields as Chairman Jerome Powell and Co. carry out an outcome based approach for monetary policy.
In turn, the decline from the February high (0.7465) may turn out to be a change in NZD/USD behavior if former support now acts as resistance, but the recent flip in retail sentiment has largely dissipated as open interest narrows 8.34% from the previous week.
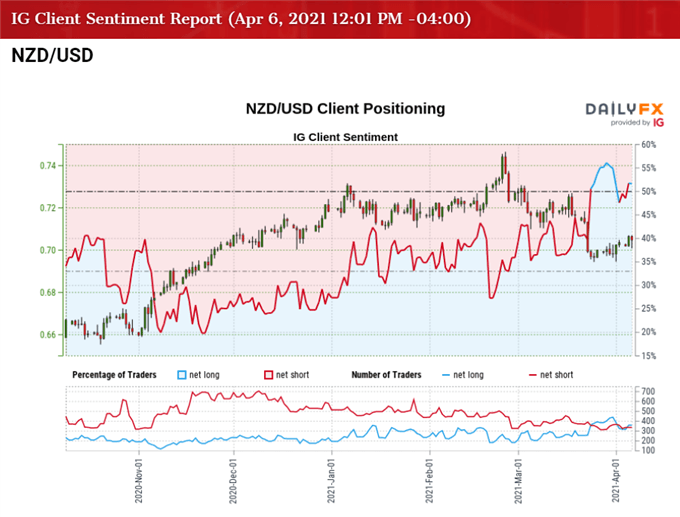
The IG Client Sentiment Report shows 49.57% of traders are currently net-long NZD/USD, with the ratio of traders short to long-standing at 1.02 to 1.
The number of traders net-long is 3.65% lower than yesterday and 14.46% lower from last week, while the number of traders net-short is 6.08% higher than yesterday and 1.41% lower from last week. Retail traders are now net-short NZD/USD as the IG Client Sentiment index stood at 57.22% last week, with the decline in net-long interest materializing as the exchange rate struggles to extend the series of higher highs and lows from the start of the month.
With that said, a further pullback in longer-dated Treasury yields may keep NZD/USD afloat especially as the Relative Strength Index (RSI) breaks out of the downward trend from earlier this year, but the recent rebound in the exchange rate may end up being short lived as the measured move for the head-and-shoulders formation keeps the downside targets on the radar.
NZD/USD RATE DAILY CHART
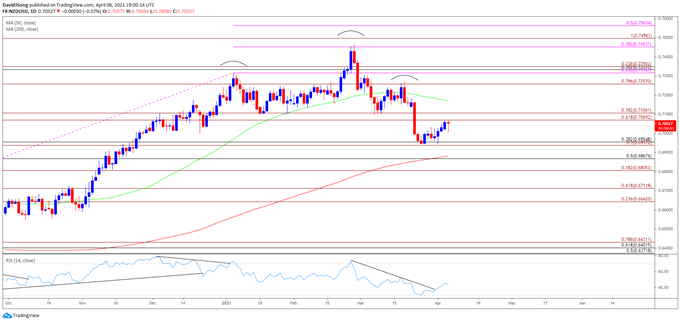
Source: Trading View
- A head-and-shoulders formation has materialized in 2021 as NZD/USD trades below the 50-Day SMA (0.7170) for the first time November, and the decline from the February high (0.7465) may turn out to be a change in trend as the exchange rate breaks below the neckline in March.
- As a result, the measured move for the head-and-shoulders formation may bring the downside targets back on the radar if the former support zone around 0.7070 (61.8% expansion) to 0.7110 (38.2% expansion) acts as resistance, with a break/close below the 0.6940 (50% expansion) to 0.6960 (38.2% retracement) region opening up the Fibonacci overlap around 0.6810 (38.2% expansion) to 0.6870 (50% retracement).
- However, NZD/USD may continue to defend the February low (0.6943) as the Relative Strength Index (RSI) reverses course ahead of oversold territory and breaks out of the downward trend from earlier this year.
- A break/close above the former support zone around 0.7070 (61.8% expansion) to 0.7110 (38.2% expansion) may push NZD/USD towards the 0.7260 (78.6% expansion) region, with the next area of interest coming in around 0.7320 (23.6% expansion) to 0.7350 (23.6% expansion).
Disclosure: See the full disclosure for DailyFX here.


