
NZD/USD Rate Rebound Emerges Within Head-and-Shoulders Formation
NZD/USD extends the rebound from the March low (0.6943) as the RSI fails to push into oversold territory, and the bearish momentum may continue to abate over the remainder of the month if the oscillator breaks out of the downward trend carried over from the previous month.
It remains to be seen if the decline from the February high (0.7465) will turn out to be a change in NZD/USD behavior or a correction in the broader trend as the exchange rate trades below the 50-Day SMA (0.7190) for the first time since November, but the New Zealand Dollar may face headwinds ahead the next Reserve Bank of New Zealand (RBNZ) interest rate decision on April 14 as the government adjusts the ‘bright-line test’ in an effort to avoid a housing market bubble.
As a result, the head-and-shoulders formation may push NZD/USD towards the November low (0.6589) amid the break below the neckline, with the depreciation in the exchange rate spurring a shift in retail sentiment as trader turn net-long the pair for the first time since September.
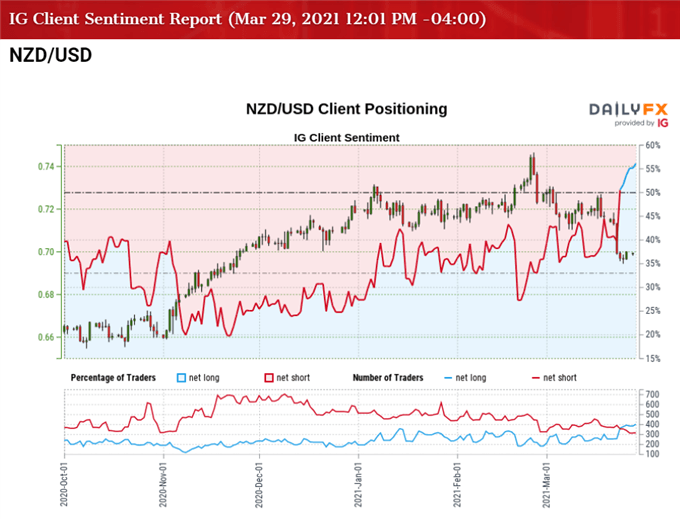
The IG Client Sentiment Report shows 57.22% of traders are currently net-long NZD/USD, with the ratio of traders long to short standing at 1.34 to 1.
The number of traders net-long is 14.44% higher than yesterday and 65.78% higher from last week, while the number of traders net-short is 4.82% higher than yesterday and 18.09% lower from last week. The jump in net-long interest appears to be largest culprit behind the shift in retail sentiment as only 45.77% of traders were net-long NZD/USD last week, while the decline in net-short position could be a function of profit-taking behavior as the exchange rate bounces back from a fresh yearly low (0.6943).
With that said, the recent rebound in NZD/USD may end up being short-lived as the measured move for the head-and-shoulders formation keeps the downside targets on the radar, and the RSI may reinforce a bearish outlook for the exchange rate if it continues to track the downward trend carried over from the previous month.
NZD/USD RATE DAILY CHART
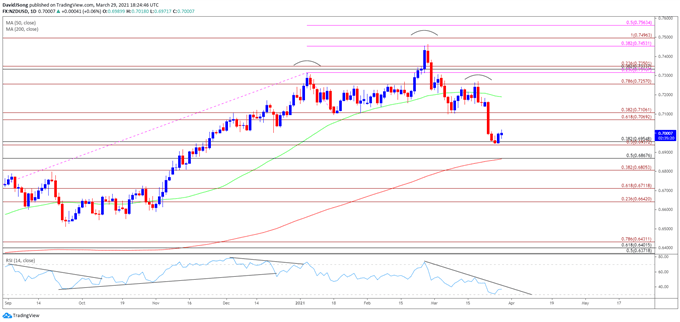
Source: Trading View
- Keep in mind, NZD/USD cleared the June 2018 high (0.7060) in December as it climbed to fresh yearly highs throughout the month, with the Relative Strength Index (RSI) pushing into overbought territory during the same period as the oscillator established an upward trend in the second half of 2020.
- NZD/USD took out the 2020 high (0.7241) during the first week of January to come up against the Fibonacci overlap around 0.7330 (38.2% retracement) to 0.7350 (23.6% expansion), with the bullish price action pushing the RSI into overbought territory.
- However, the move above 70 in the RSI was short-lived as the indicator failed to retain the upward trend from 2020, with the oscillator indicating a textbook sell signal during the first week of January as it quickly fell back from overbought territory.
- A similar development occurred toward the end of February as NZD/USD pulled back from a fresh yearly high (0.7465), but a head-and-shoulders formation has taken shape, with the exchange rate slipping below the neckline as it failed to defend the opening range for March.
- NZD/USD has snapped the series of lower highs and lows from the previous week amid the failed attempt to break/close below the 0.6940 (50% expansion) to 0.6960 (38.2% retracement) region, with the exchange rate approaching the former support zone around 0.7070 (61.8% expansion) to 0.7110 (38.2% expansion) as the RSI struggles to push into oversold territory.
- The RSI may show the bearish momentum abating if the indicator manages to break out of the downward trend from earlier this year, but the recent rebound in NZD/USD may end up being short-lived if the oscillator continues to track the bearish formation.
- Need a break/close below the 0.6940 (50% expansion) to 0.6960 (38.2% retracement) zone to bring the 0.6810 (38.2% expansion) to 0.6870 (50% retracement) area on the radar, with the next region of interest coming in around 0.6710 (61.8% expansion).
Disclosure: See the full disclosure for DailyFX here.


