
NZD/USD Rate Outlook Mired By Failure To Test January High
NZD/USD climbed to fresh monthly highs after breaking out of the descending channel formation from earlier this year, but the exchange rate seems to have reversed course ahead of the January high (0.7315) as the US Dollar appreciates against its major counterparts.
In turn, NZD/USD may consolidate ahead of the next Reserve Bank of New Zealand (RBNZ) meeting on February 24 as the country currently faces a three-day lockdown, and the threat of a protracted recovery may encourage Governor Adrian Orr and Co. to further support the economy as the central bank is “prepared to lower the OCR (official cash rate) to provide additional stimulus if required.”
Until then, key market themes may influence NZD/USD as the Federal Reserve stays on track to “increase our holdings of Treasury securities by at least $80 billion per month and of agency mortgage-backed securities by at least $40 billion per month,” and the tilt in retail sentiment also looks poised to persist as traders have been net-short the pair since October.
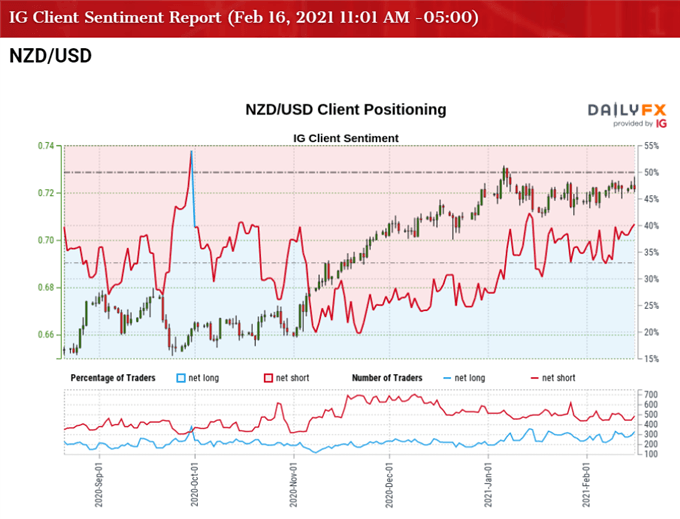
The IG Client Sentiment Report shows 39.68% of traders are currently net-long NZD/USD as the ratio of traders short to long stands at 1.52 to 1.
The number of traders net-long is 0.67% lower than yesterday and 8.59% lower from last week, while the number of traders net-short is 9.76% lower than yesterday and 11.00% lower from last week. The decline in net-long positions comes as NZD/USD appears to be reversing course ahead of the January high (0.7315), while the decline in net-short interest has helped to alleviate the crowding behavior as only 36.72% of traders were net-long the pair last week.
With that said, the decline from the January high (0.7315) may turn out to be an exhaustion in the broader trend rather than a change in market behavior as NZD/USD largely preserves the advance off of the 50-Day SMA (0.7161), and key market themes may keep the exchange rate afloat.
NZD/USD RATE DAILY CHART

Source: Trading View
- Keep in mind, NZD/USD cleared the June 2018 high (0.7060) in December as it climbed to a fresh yearly highs throughout the month, with the Relative Strength Index (RSI) pushing into overbought territory during the same period as the oscillator established an upward trend in the second half of 2020.
- NZD/USD took out the 2020 high (0.7241) during the first week of January to come up against the Fibonacci overlap around 0.7330 (38.2% retracement) to 0.7350 (23.6% expansion), with the bullish price action pushing the RSI into overbought territory.
- However, the move above 70 in the RSI was short-lived as the indicator failed to retain the upward trend from 2020, with the oscillator indicating a textbook sell signal during the first week of January as it quickly fell back from overbought territory.
- Nevertheless, NZD/USD responded to the 50-Day SMA (0.7161) after failing to test last month’s low (0.7096), with the exchange rate still tracking the January range amid the lack of momentum to push below the Fibonacci overlap around 0.7070 (61.8% expansion) to 0.7110 (38.2% expansion).
- Need a close above the 0.7260 (78.6% expansion) region to bring the topside targets back on the radar even though NZD/USD breaks out of the descending channel formation from earlier this year, with the next hurdle coming in around 0.7330 (38.2% retracement) to 0.7350 (23.6% expansion).
- At the same time, lack of momentum to close above the 0.7260 (78.6% expansion) region may spur another test of the 50-Day SMA (0.7161), with a move below the moving average opening up the Fibonacci overlap around 0.7070 (61.8% expansion) to 0.7110 (38.2% expansion).
Disclosure: See the full disclosure for DailyFX here.


