
NZD/USD Rate Holds Above 50-SMA To Target March High
NZD/USD reveres ahead of the monthly low (0.7115) to hold above the 50-Day SMA (0.7139), and the exchange rate may continue to negate the head-and-shoulders formation from earlier this year as the Fed stays on track to “increase our holdings of Treasury securities by at least $80 billion per month and of agency mortgage-backed securities by at least $40 billion per month.”

NZD/USD looks poised to retrace the decline following the update to the US Consumer Price Index (CPI) as Fed officials retain a dovish forward guidance for monetary policy, and the FOMC Minutes may generate a bearish reaction in the US Dollar as the central bank shows little intentions of switching gears ahead of the second half of the year.
It seems as though the FOMC is in no rush to scale back its emergency measures as the committee warns that it will “take some time for substantial further progress to be achieved,” and it remains to be seen if Chairman Jerome Powell and Co. will change its tone at its next interest rate decision on June 16 as the central bank is slate to update the Summary of Economic Projections (SEP).
Until then, NZD/USD may continue to trade within in the March range as it negates the head-and-shoulders formation from earlier this year, but the renewed tilt in retail sentiment may lead to a test of the March high (0.7307) as the crowding behavior from 2020 resurfaces.
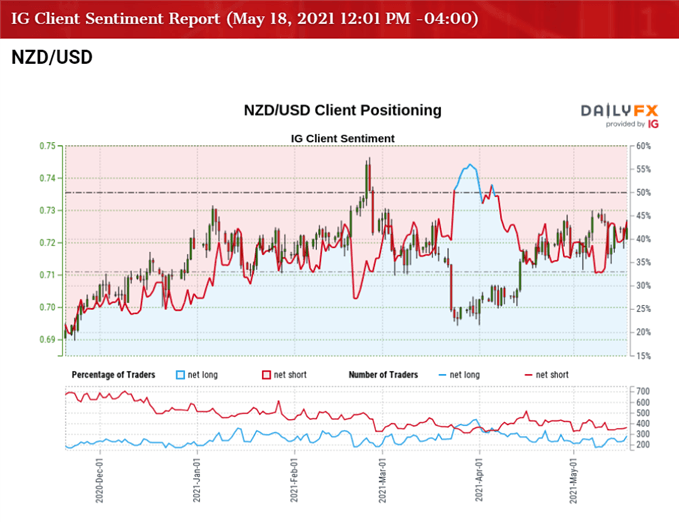
The IG Client Sentiment report shows 45.06% of traders are currently net-long NZD/USD, with the ratio of traders short to long standing at 1.22 to 1.
The number of traders net-long is 15.33% higher than yesterday and 27.00% higher from last week, while the number of traders net-short is 4.43% lower than yesterday and 7.09% lower from last week. The jump in net-long interest has helped to alleviate the tilt in retail sentiment as only 37.50% of traders were net-long NZD/USD last week, while the decline in net-short position comes as the exchange rate approaches the monthly high (0.7305).
With that said, the decline from the yearly high (0.7465) may turn out to be a correction in the broader trend rather than a key reversal as the crowding behavior from 2020 resurfaces, and the exchange rate may attempt to test the March high (0.7307) as it reverses ahead of the monthly low (0.7115) to hold above the 50-Day SMA (0.7139).
NZD/USD RATE DAILY CHART
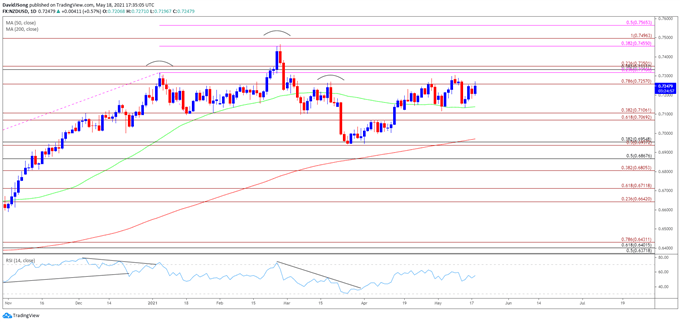
Source: Trading View
- A head-and-shoulders formation materialized in 2021 as NZD/USD slipped below the 50-Day SMA (0.7139) for the first time since November, but the decline from the yearly high (0.7465) may turn out to be a correction in the broader trend rather than a key reversal as the exchange rate trades back above the neckline.
- The Relative Strength Index (RSI) highlights a similar dynamic as it reversed ahead of oversold territory to break out of the downward trend from earlier this year, with NZD/USD climbing back above the 50-Day SMA (0.7139) after defending the March low (0.6943) in April.
- NZD/USD may continue to hold above the 50-Day SMA (0.7139) as it reveres ahead of the monthly low (0.7115), but need a close above the 0.7260 (7.86% expansion) region to bring the Fibonacci overlap around 0.7320 (23.6% expansion) to 0.7350 (23.6% expansion) on the radar.
- Next area of interest comes in around 0.7450 (38.2% expansion) to 0.7500 (100% expansion), which lines up with the February high (0.7465), followed by the 0.7570 (50% expansion) region.
Disclosure: See the full disclosure for DailyFX here.


