
NZD/USD Rate Approaches Monthly Low As RSI Sell Signal Emerges
NZD/USD approaches the monthly low (0.7006) as the RSI falls back from overbought territory, and the correction from the yearly high (0.7104) may gather pace as the US Dollar continues to reflect an inverse relationship with investor confidence.
Swings in risk appetite may continue to sway NZD/USD as the Federal Reserve appears to be on track to deliver a dovish forward guidance at its next interest rate decision on December 16, and it seems as though the central bank will rely on its current tools to support the US economy as “participants judged that it would be appropriate over coming months for the Federal Reserve to increase its holdings of Treasury securities and agency MBS at least at the current pace.”
It remains to be seen if the Federal Open Market Committee (FOMC) will adjust the monetary policy outlook ahead 2021 as Chairman Jerome Powell and Co. “assess how our ongoing asset purchases can best support our maximum employment and price-stability objectives as well as market functioning and financial stability,” but the break above the June 2018 high (0.7060) suggests that the recent weakness in NZD/USD could end up being an exhaustion in the bullish trend rather than a change in market behavior as key market trends look poised to persist in the year ahead.
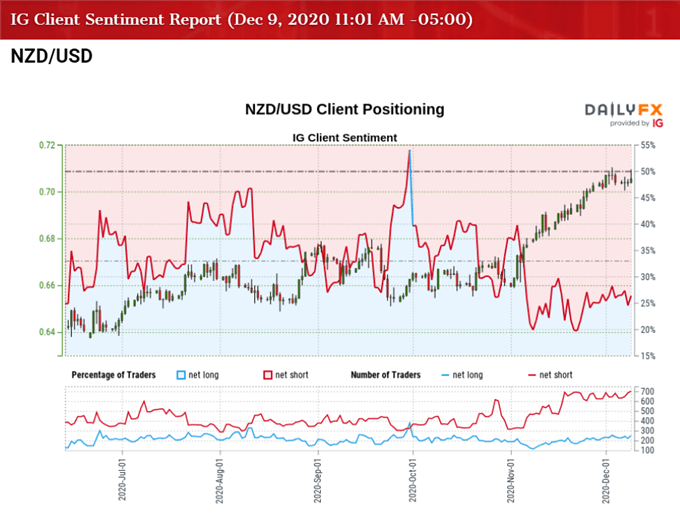
At the same time, the tilt in retail sentiment from earlier this year has resurfaced as the IG Client Sentiment Report shows 25.44% of traders net-long NZD/USD, with the ratio of traders short to long-standing at 2.93 to 1. The number of traders net-long is 5.76% lower than yesterday and 5.76% lower from last week, while the number of traders net-short is 4.28% lower than yesterday and 0.15% lower from last week.
The decline in net-long position comes as NZD/USD approaches the monthly low (0.7006), while the minor shift in net-short interest has done little to alleviate the tilt in retail sentiment as 26.65% of traders were net-long the pair earlier this week.
With that said, the recent weakness in NZD/USD could end up being an exhaustion in the bullish trend rather than a change in market behavior as key market trends look poised to persist, but the Relative Strength Index (RSI) warns of a larger pullback in the exchange rate as the indicator slips below 70 to offer a textbook sell signal.
NZD/USD RATE DAILY CHART
(Click on image to enlarge)
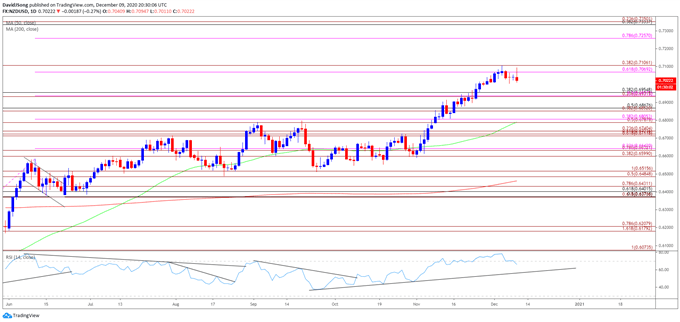
Source: Trading View
- Keep in mind, NZD/USD cleared the February high (0.6503) in June as the Relative Strength Index (RSI) broke above 70 for the first time in 2020, with the exchange rate taking out the January high (0.6733) in September following the close above the Fibonacci overlap around 0.6710 (61.8% expansion) to 0.6740 (23.6% expansion).
- However, lack of momentum to close above the 0.6790 (50% expansion) region pushed NZD/USD below the Fibonacci overlap around 0.6600 (38.2% expansion) to 0.6630 (78.6% expansion), with the RSI slipping to its lowest level since April during the same period.
- NZD/USD appeared to be on track to test the August low (0.6489) as the RSI established a downward trend in September, but the decline from the September high (0.6798)turned out to be an exhaustion in the bullish trend rather than a change in NZD/USD behavior as the 0.6490 (50% expansion) to 0.6520 (100% expansion) region provided support.
- The RSI highlighted a similar dynamic as it reverses course ahead of oversold territory to break out of the bearish formation from September, with the oscillator establishing an upward trend in October.
- Lack of momentum to test the August low (0.6489) pushed NZD/USD back above the 0.6600 (38.2% expansion) to 0.6630 (78.6% expansion) region, with the exchange rate clearing the September high (0.6798) in November, which pushed the RSI into overbought territory for the first time since June.
- NZD/USD also cleared the June 2018 high (0.7060) as it climbed to a fresh yearly high (0.7104) in December, but a textbook RSI sell signal appears to have taken shape following the failed attempt to break/close above the 0.7070 (61.8% expansion) to 0.7140 (50% expansion) region.
- Failure to hold above the Fibonacci overlap around 0.6930 (23.6% expansion) to 0.6960 (38.2% retracement) opens up the 0.6850 (38.2% expansion) to 0.6870 (50% retracement) region, with the next area of interest coming in around 0.6790 (50% expansion) to 0.6810 (38.2% expansion).
- Nevertheless, the recent weakness in NZD/USD could end up being an exhaustion in the bullish trend rather than a change in market behavior as the RSI tracks the upward trend established in September, with both the 50-Day (0.6789) and 200-Day SMA (0.6461) establishing a positive slope ahead of 2021.
Disclosure: See the full disclosure for DailyFX here.


