
NZD/USD Rally Spurs Test Of 200-Day SMA Ahead Of US NFP Report
NZD/USD tests the 200-Day SMA (0.7112) for the first time since July as it extends the series of higher highs and lows from earlier this week, and the reaction to the weaker-than-expected ADP Employment survey may act as a guide for the NFP report as Fed Chairman Jerome Powell insists that “we have much ground to cover to reach maximum employment.”

A dismal development is likely to produce a bearish reaction in the US Dollar as saps speculation for an imminent shift in Fed policy, while a better-than-expected NFP report may undermine the recent rally in NZD/USD as it puts pressure on the Federal Open Market Committee (FOMC) to deploy an exit strategy sooner rather than later.
As a result, it remains to be seen if the FOMC will switch gears ahead of its New Zealand counterpart as Reserve Bank of New Zealand (RBNZ) Assistant Governor Christian Hawkesbyreveals that “a 50 basis point move was definitely on the table” at their meeting earlier this month, and fresh data prints coming out of the US may continue to produce headwinds for the Greenback amid signs of a less robust recovery.
In turn, NZD/USD may stage a larger advance ahead of the next Fed rate decision on September 22 as it takes out the July high (0.7105), but a further appreciation in the exchange rate may fuel the flip in retail sentiment like the behavior seen earlier this year.
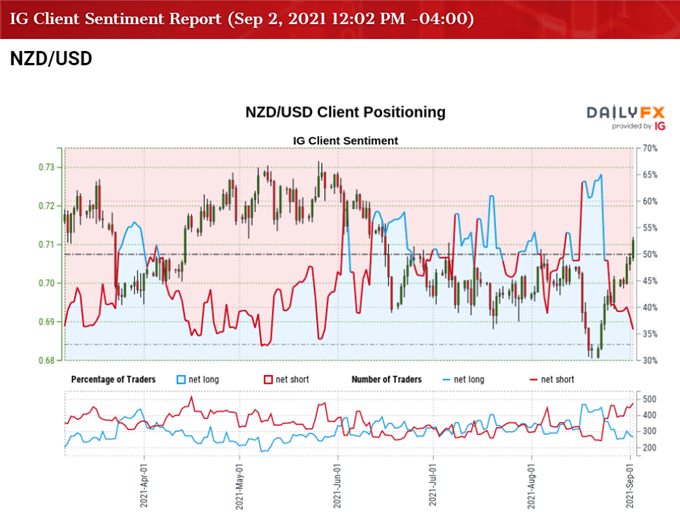
The IG Client Sentiment Report shows 35.25% of traders are currently net-long NZD/USD, with the ratio of traders short to long standing at 1.84 to 1.
The number of traders net-long is 6.88% lower than yesterday and 21.41% lower from last week, while the number of traders net-short is 3.28% higher than yesterday and 7.03% higher from last week. The decline in net-long interest could be a function of profit-taking behavior as NZD/USD tests the 200-Day SMA (0.7112) for the first time since July, while the rise in net-short position has helped to fuel the recent flip in retail sentiment as 42.08% of traders were net-long the pair last week.
With that said, the break above the July high (0.7105) may generate a large recovery in NZD/USD as it extends the series of higher highs and lows from earlier this week, but the advance from the August low (0.6805) may turn out to be a correction in the broader trend as the exchange rate trades to fresh yearly lows in the second half of 2021.
NZD/USD RATE DAILY CHART
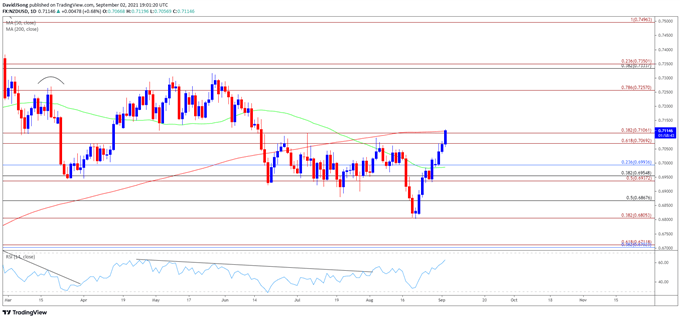
Source: Trading View
- Keep in mind, a head-and-shoulders formation materialized in the first quarter of 2021 as NZD/USD slipped below the 50-Day SMA (0.6985) for the first time since November, with the decline from the yearly high (0.7465) pushing the exchange rate below the 200-Day SMA (0.7110) for the first time since June 2020.
- However, NZD/USD has reversed course ahead of the November 2020 low (0.6589) amid the failed attempt to close below the 0.6810 (38.2% expansion) region, with the exchange rate testing the 200-Day SMA (0.7112) for the first time since July.
- Need a close above the Fibonacci overlap around 0.7070 (61.8% expansion) to 0.7110 (38.2% expansion) to bring the 0.7260 (78.6% expansion) area on the radar, with the next region of interest coming in around 0.7330 (38.2% retracement) to 0.7350 (23.6% expansion).
- However, lack of momentum to hold above the 200-Day SMA (0.7112) may bring the 0.6990 (23.6% retracement) region back on the radar, with the next area of interest coming in around 0.6940 (50% expansion) to 0.6960 (38.2% retracement).
Disclosure: See the full disclosure for DailyFX here.


